Build Your First Data Pipeline
In this guide, we’ll walk you through creating your first data pipeline using our easy-to-use drag-and-drop interface. A Pipeline in DataFuse AI automates the movement and transformation of data from one place to another. By the end of this guide, you’ll be able to connect your data sources, apply transformations, save processed data to a sink, and visualize your data with profiling. Let’s get started!
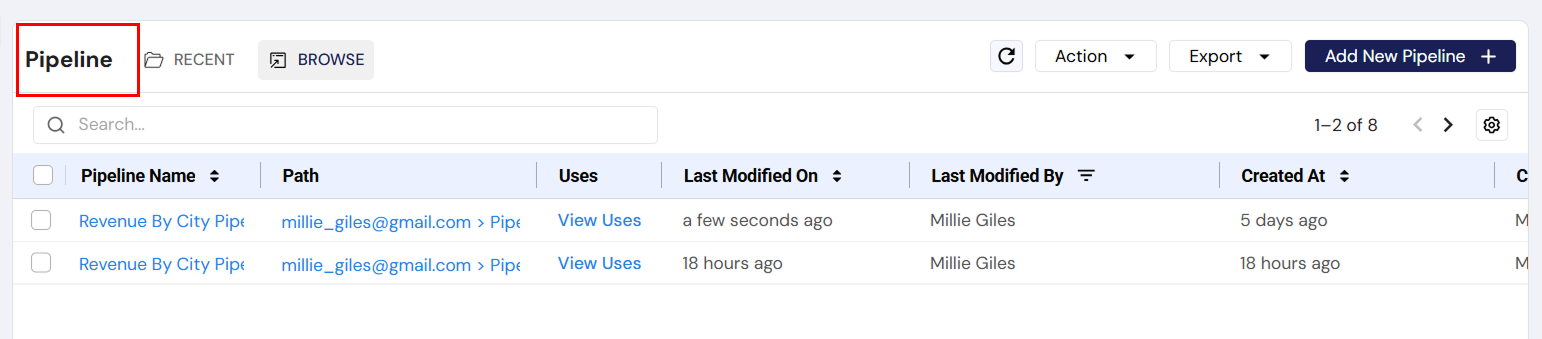
Step 1: Navigate to the Pipeline Page and Add a New Pipeline
-
Go to the Pipeline page:
-
In the left navigation sidebar, click on Pipeline.
-
This will open the Pipeline canvas where you can build your data workflows.
-
-
Add a new pipeline:
-
On the Pipeline page, click on Add New Pipeline.
-
You’ll be taken to the canvas to start building your pipeline.
-
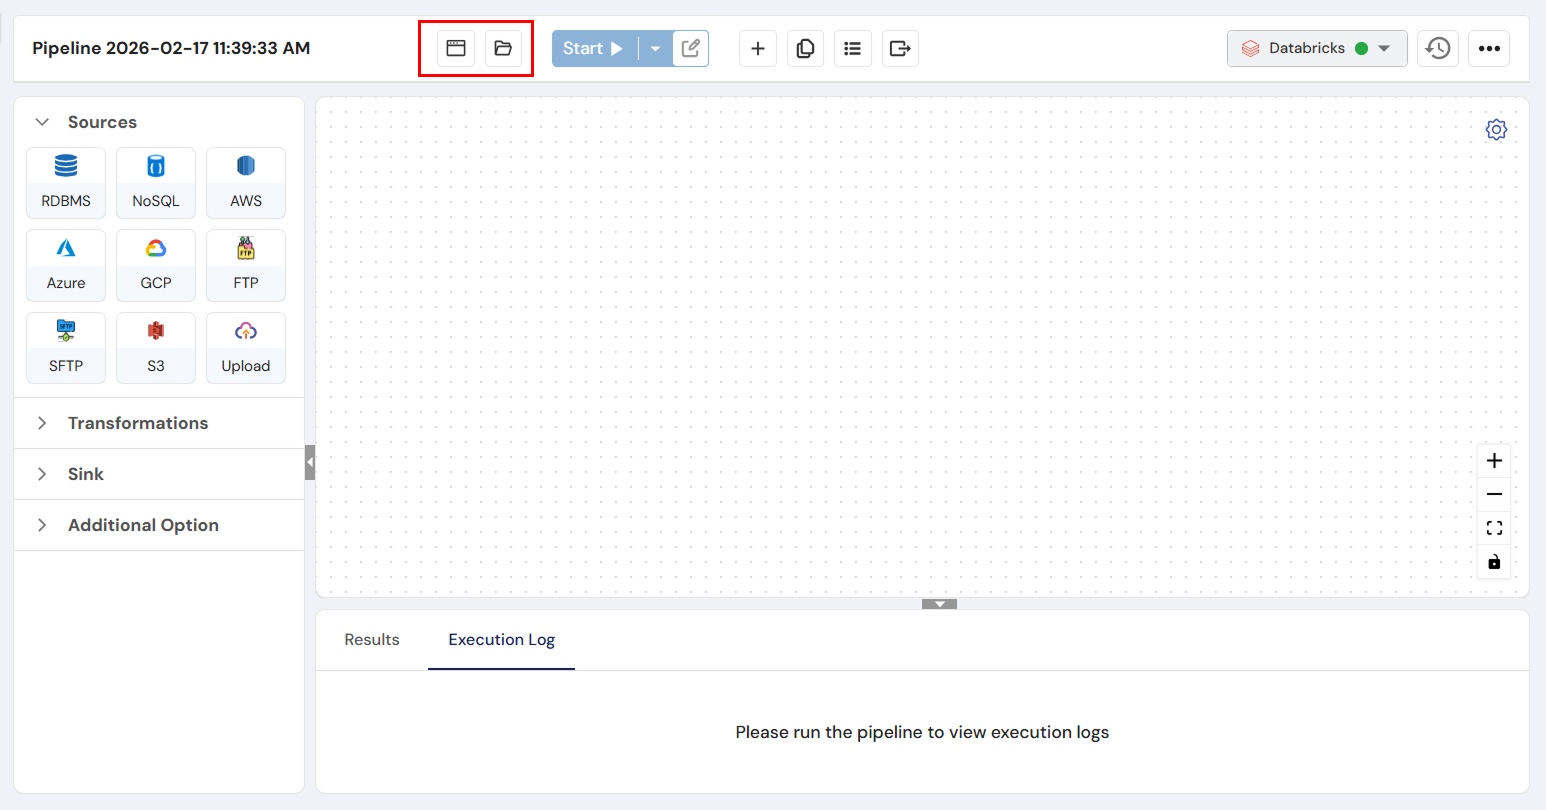
It's a good practice to give your pipeline a descriptive name, especially if you’ll be managing multiple pipelines.
-
Rename the pipeline (optional):
- To rename the pipeline, click the settings icon in the top right corner of the canvas and enter a name for your pipeline, or leave it as the default name for now.
Step 2: Add a Source
 The Source is where your data originates, such as a database or file. Let’s add a source to your pipeline.
- From the list of available sources on the left, drag and drop the source of your choice onto the canvas.
Source Options:
-
RDBMS (e.g., MySQL, PostgreSQL)
-
NoSQL (e.g., MongoDB, Cassandra)
-
AWS (e.g., S3, RDS)
-
Azure (e.g., SQL Server, Cosmos DB)
-
GCP (e.g., BigQuery)
-
FTP/SFTP
-
Upload (for files)
-
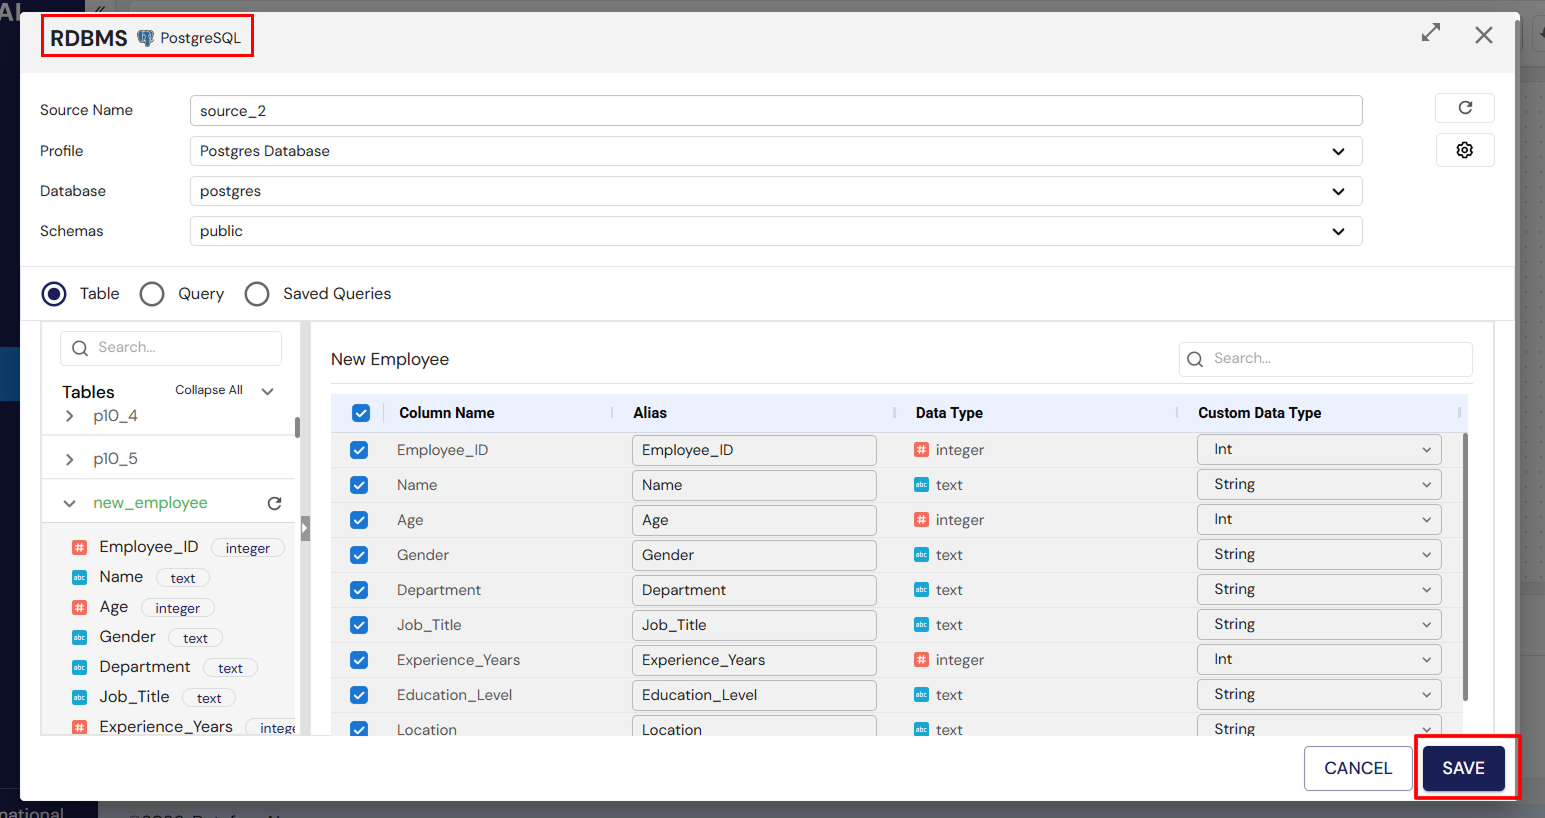
Configure the source node:
-
After adding the source, double-click the Source node to configure it.
-
Connection Profile: Choose the connection profile for your data source.
-
Database, Schema, Tables: Select the database, schema, and tables you want to pull data from.
-
Columns: Tick the checkboxes to select the columns you want to include in the pipeline.
-
The available hierarchy will depend on the type of connection profile you’ve selected. For example, MySQL will show databases only, while PostgreSQL will display schemas as well.
Step 3: Add a Transformation
 Now let’s apply some transformations to process the data.
-
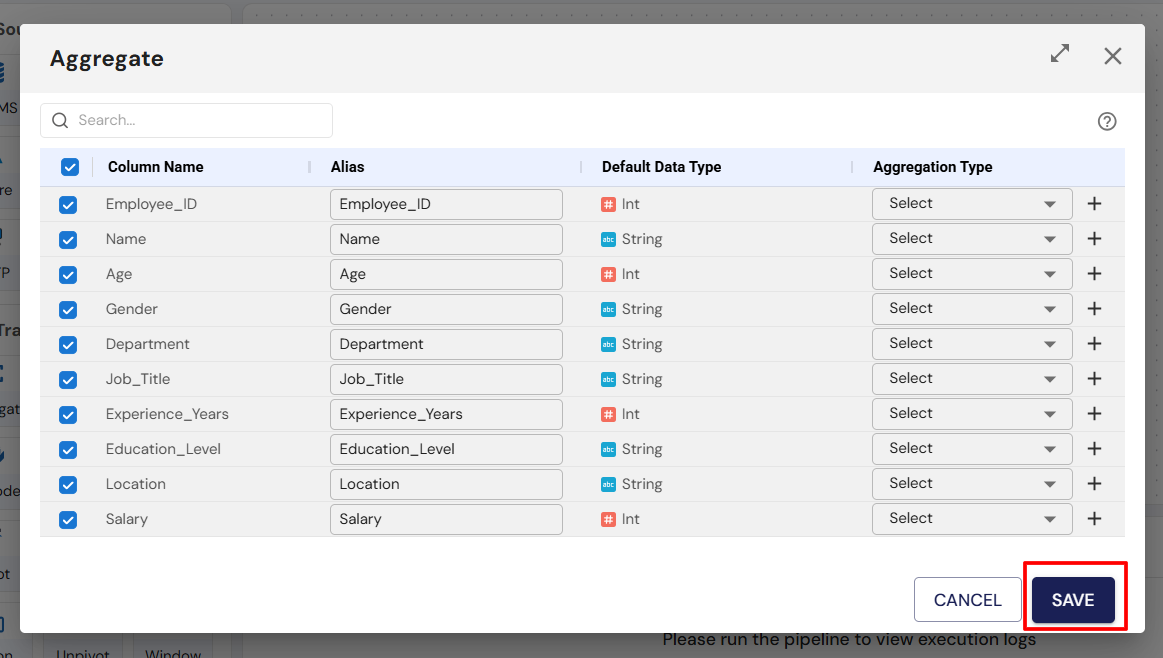
From the list of transformations, drag and drop the transformation of your choice onto the canvas. Available transformations include:
-
Aggregate: Summarize data (e.g., sum, average).
-
Dedupe: Remove duplicate records.
-
Filter: Filter data based on conditions.
-
Pivot/Unpivot: Reshape data for analysis.
-
Join: Combine data from multiple sources.
-
Split: Divide data into subsets.
-
Union: Combine multiple datasets.
-
Route: Route data based on conditions.
-
Explode: Flatten nested data.
-
Window: Perform windowed operations (e.g., running totals).
-
-
Connect the Source node to the Transformation node:
- Link the small dot at the end of the Source node to the small dot at the start of the Transformation node.
-
Configure the transformation:
- Double-click the Transformation node to configure it. For example, if you selected Aggregate, you’ll need to specify the fields to aggregate.
Step 4: Add a Sink
 The Sink is where your processed data will be saved. Currently, DataFuse AI supports RDBMS as sinks.
-
Drag and drop the Sink of your choice onto the canvas.
-
Connect the Transformation node to the Sink node:
- Link the small dot at the end of the Transformation node to the small dot at the start of the Sink node
-
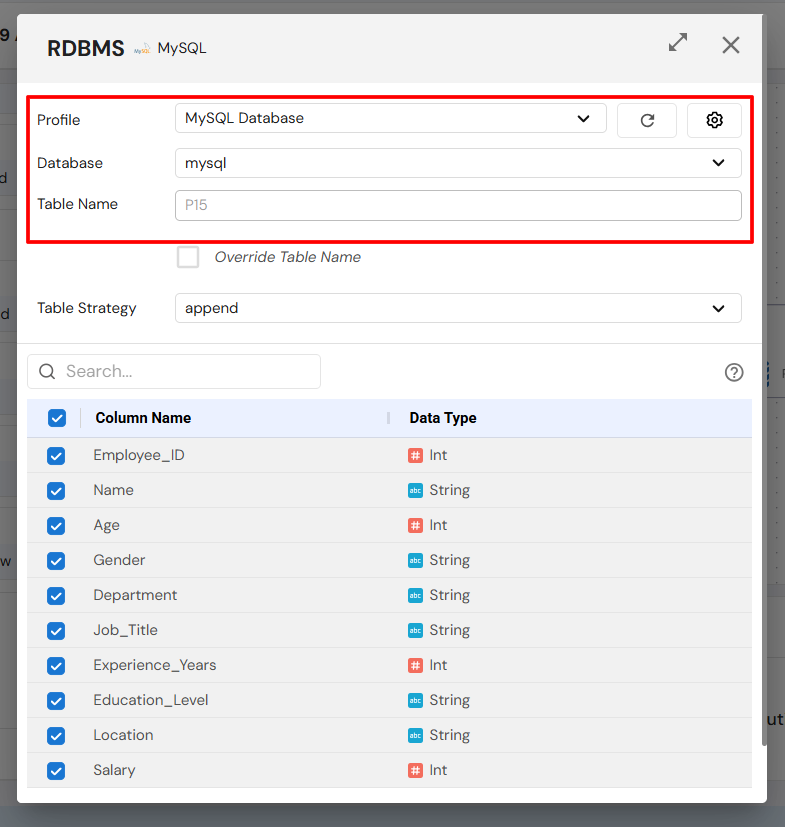
Configure the Sink node:
-
Connection Profile: Choose the destination connection profile.
-
Database, Schema, Table: Select where you want to save the data.
-
Table Strategy: Choose how to handle the data in the table:
-
Create: Create a new table.
-
Overwrite: Replace the existing table.
-
Append: Add data to an existing table.
-
-
Columns: Select which columns to include in the sink.
-
-
Save the Sink configuration.
Step 5: Add Profiling
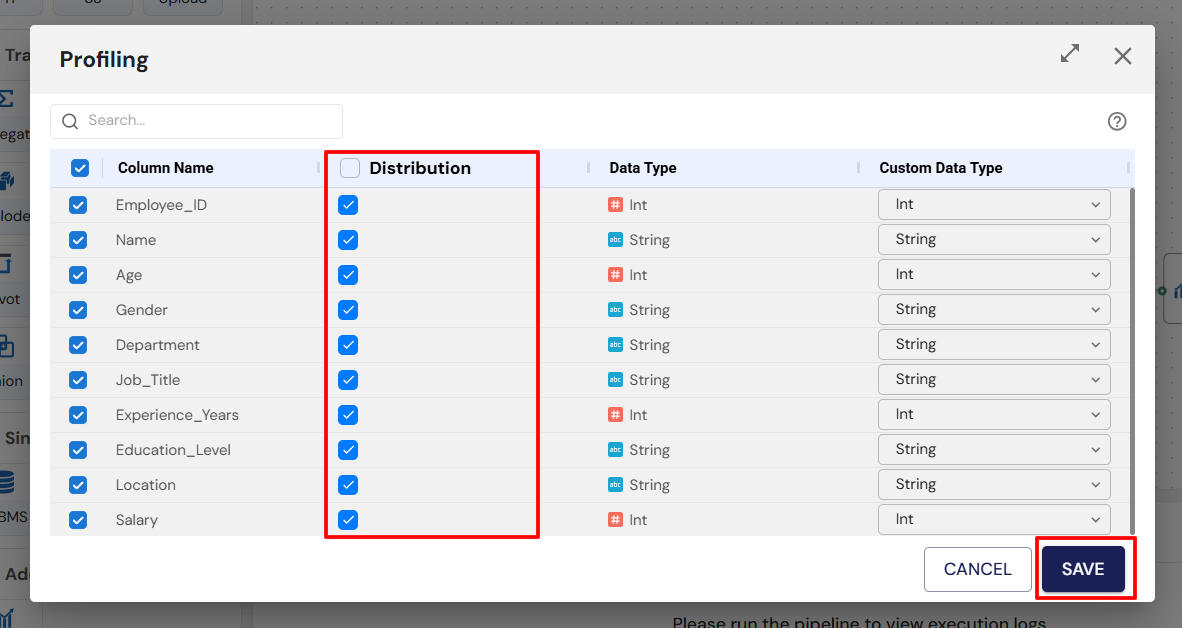
 Profiling nodes allow you to analyze and visualize your data, providing insights into its quality and structure.
-
Drag and drop a Profiling node from the list of available nodes onto the canvas.
-
Connect the Sink node to the Profiling node:
- Link the small dot at the end of the Sink node to the small dot at the start of the Profiling node.
-
Configure the Profiling node:
-
Double-click the Profiling node to configure it. This will allow you to visualize the data and check for any anomalies or insights.
-
Once done, click Save.
-
Step 6: Verify Your Pipeline Setup
Before running your pipeline, double-check the following:
-
Verify each node: Ensure the Source, Transformation, Sink, and Profiling nodes are configured correctly.
-
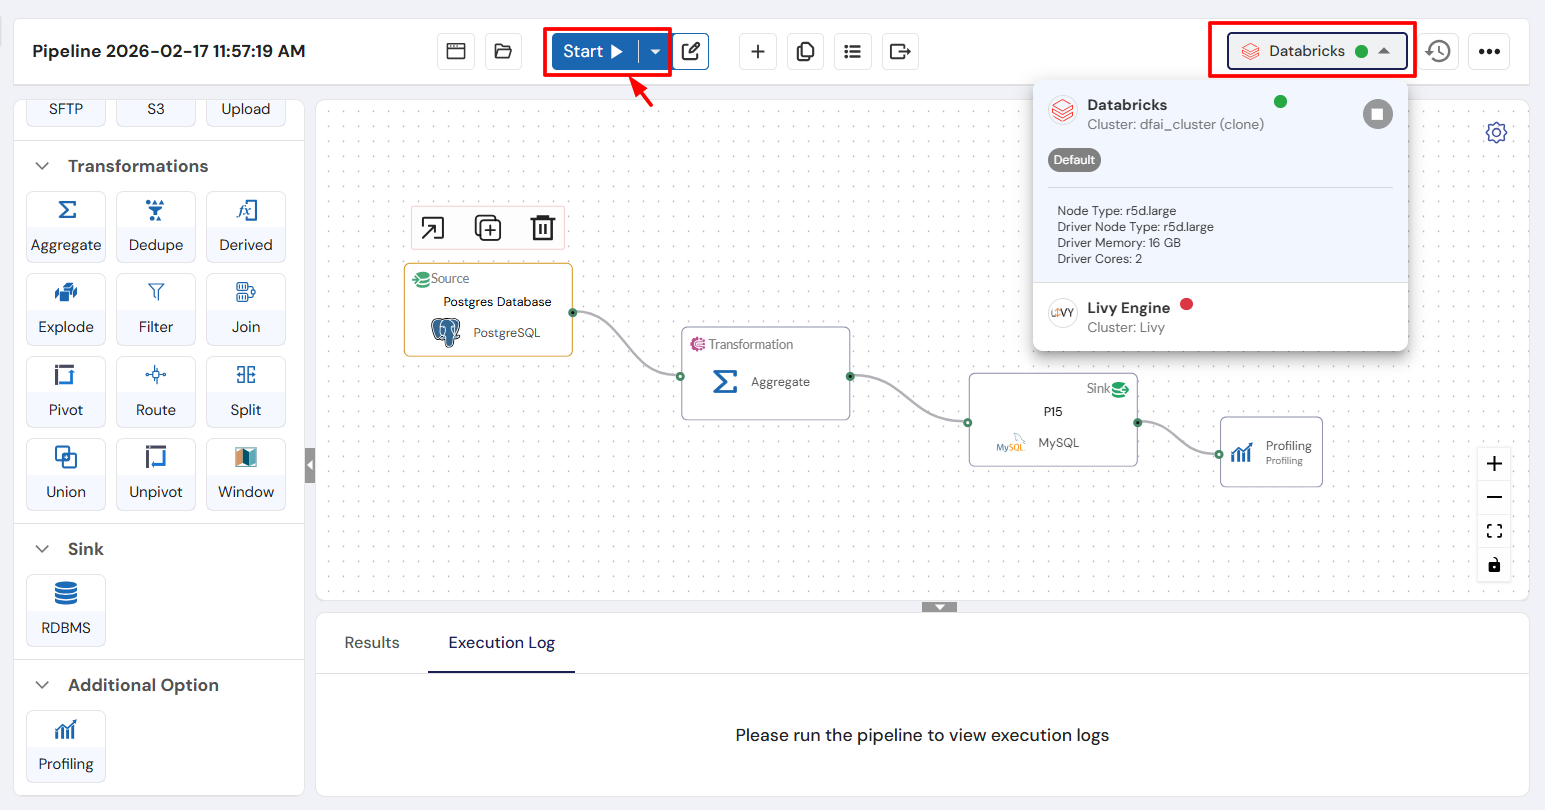
Check your engine: Make sure the correct engine is selected for processing the pipeline.
Any issues in the pipeline configuration can affect the entire workflow, so it’s important to ensure everything is set up properly before execution.
Step 7: Run the Pipeline
Once you’re confident that the pipeline is configured correctly, click Run to execute it.
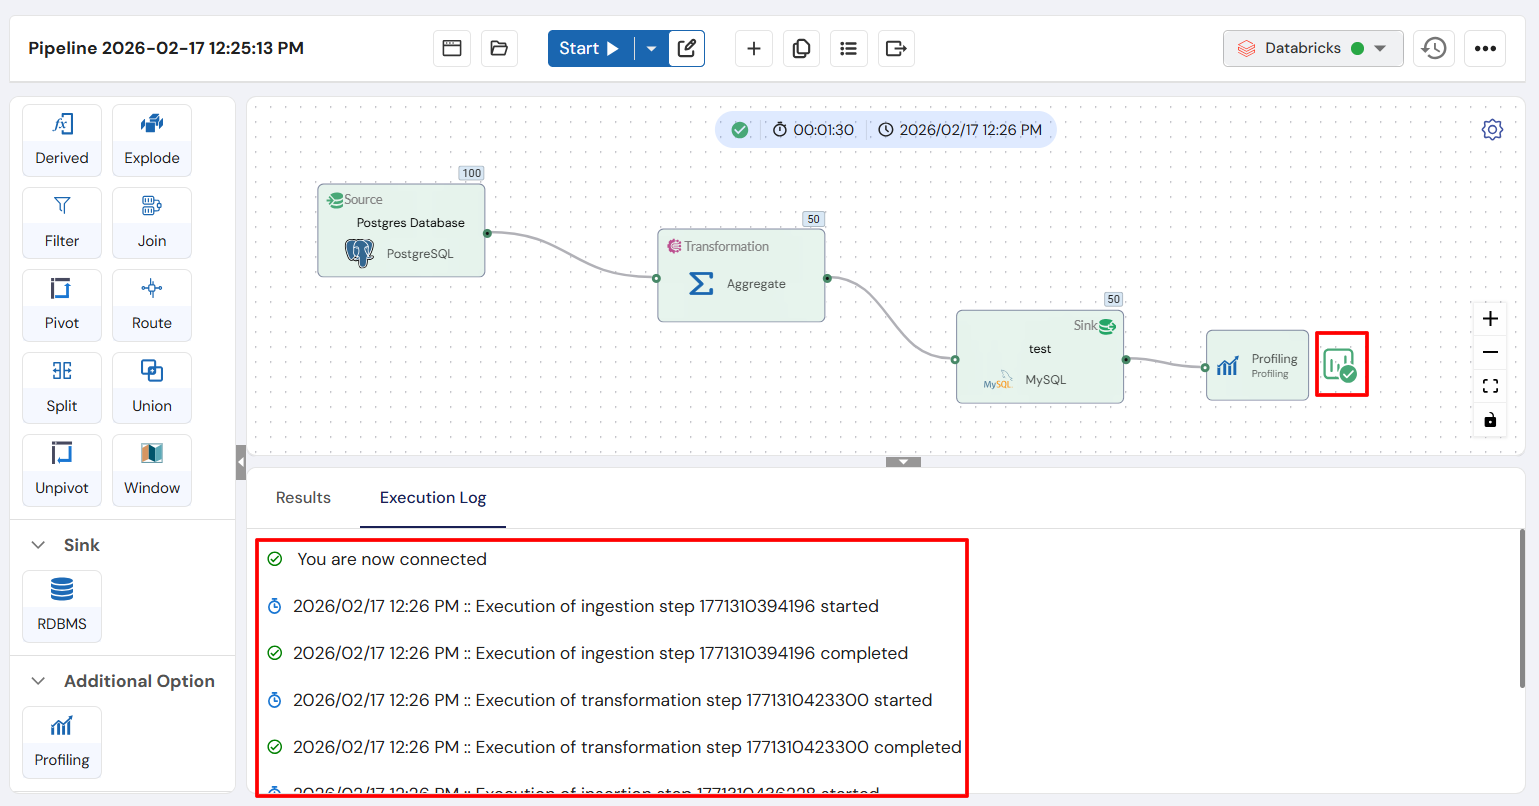
Step 8: Monitor Execution
While the pipeline is running, you can monitor its progress:
- Execution Logs: View real-time logs to track the pipeline’s status.
Step 9: Review Results
After the pipeline completes:
-
Execution Logs: Review the logs for any errors or issues that occurred during the run.
-
Sink Results: Check the final data in the destination table to ensure it was processed correctly.
Important: Execution logs are critical for debugging any issues that occur during pipeline execution.
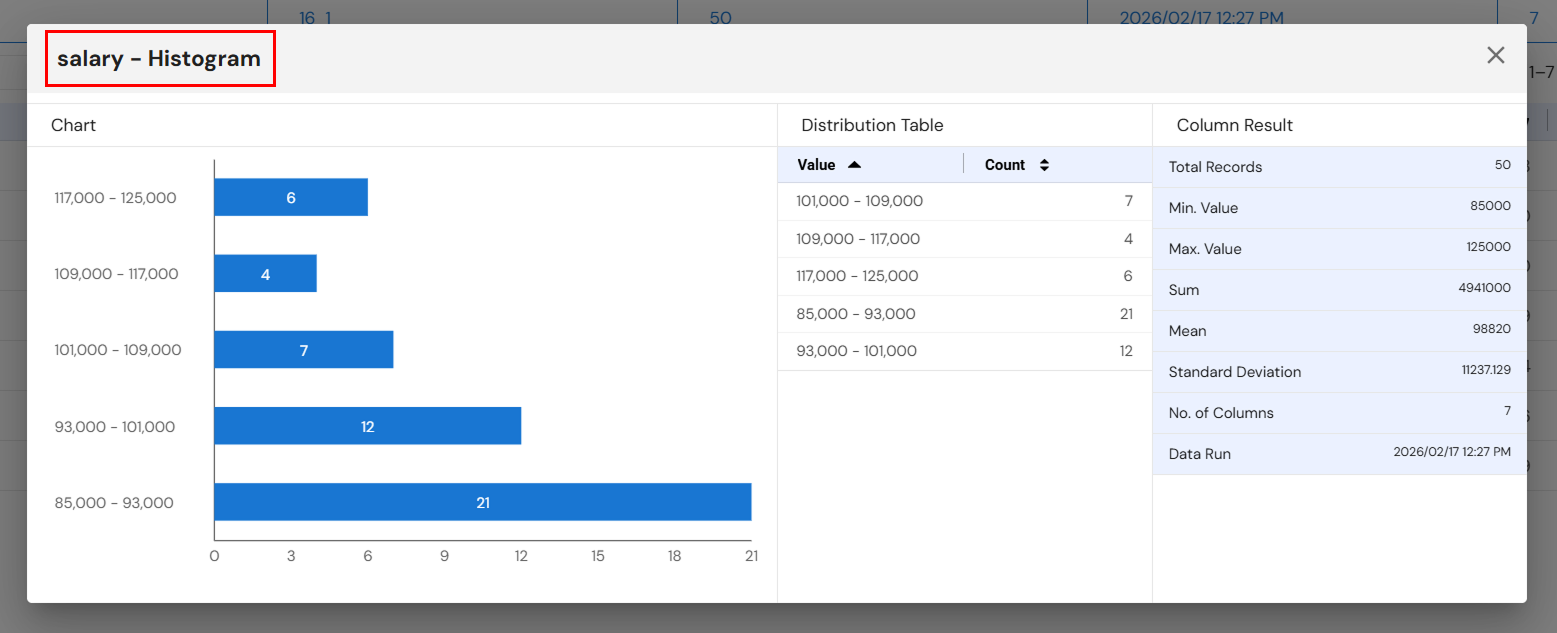
Step 10: Profiling Insights
After the pipeline finishes running, you can access Profiling Insights by clicking the small icon after the Profiling node. This will provide detailed data analysis and insights, allowing you to evaluate the quality and structure of the processed data.
Next Steps
Congratulations on successfully building and running your first pipeline! You’re now ready to:
-
Explore More Transformations: Dive deeper into the available transformations to refine your data workflows.
-
Build More Pipelines: Start creating additional pipelines to automate more data processing tasks.
-
Schedule Jobs: Automate the execution of pipelines by setting up recurring jobs.
For more detailed guidance on each component, visit the Core Modules section.
With your first pipeline successfully created, you’re now ready to fully leverage the power of DataFuse AI’s data processing capabilities. Happy pipeline building!