Pipeline
The DataFuse AI Pipeline Module serves as a powerful tool to automate and streamline the process of moving and transforming data. Data engineers and data scientists use pipelines to handle complex data workflows without needing to manually intervene in each step. From extracting data from multiple sources, cleaning and transforming it, to loading it into storage or analytics systems, DataFuse AI simplifies the entire process. The module's intuitive visual interface allows users to design, execute, and monitor their pipelines in a way that is accessible, even to those with limited coding experience.
Key Benefits
- Automation: Pipelines automatically execute data processing tasks, which reduces manual work and ensures that processes run on time without human oversight.
- Efficiency: Pipelines can handle large volumes of data and complex workflows, meaning they scale effectively even as data sizes and requirements grow.
- Real-time Monitoring: Users can track the progress of their pipelines in real time, ensuring immediate visibility into any issues or delays.
- Customization: Pipelines are highly customizable, enabling users to apply filters, transformations, and other changes based on their specific needs.
- Download Results: After the pipeline has executed, users can download the transformed data, making it easy to store, analyze, or share results.
- Sharing Profiling Data: Profiling data can be shared via email, helping teams collaborate and share insights from the data analysis process.
Use Cases
- Data Extraction: Automatically pulling data from CRM systems (like Salesforce), cleaning it, and loading it into a reporting database for easier analysis.
- Data Transformation: Aggregating daily sales data into a warehouse for future use in reporting, trend analysis, or forecasting.
- Data Loading: Combining multiple data sources, transforming the data, and loading it into analytics platforms such as Tableau, Power BI, or custom dashboards.
Pipeline Listing Section
Overview
The Pipeline Listing Section is a key interface for managing the pipelines within the system. This section is accessible via the left navigation sidebar under the "Pipeline" tab and provides users with tools to interact with and manage their pipelines. The section consists of a variety of features aimed at organizing, modifying, and exporting pipeline data.
Key Features
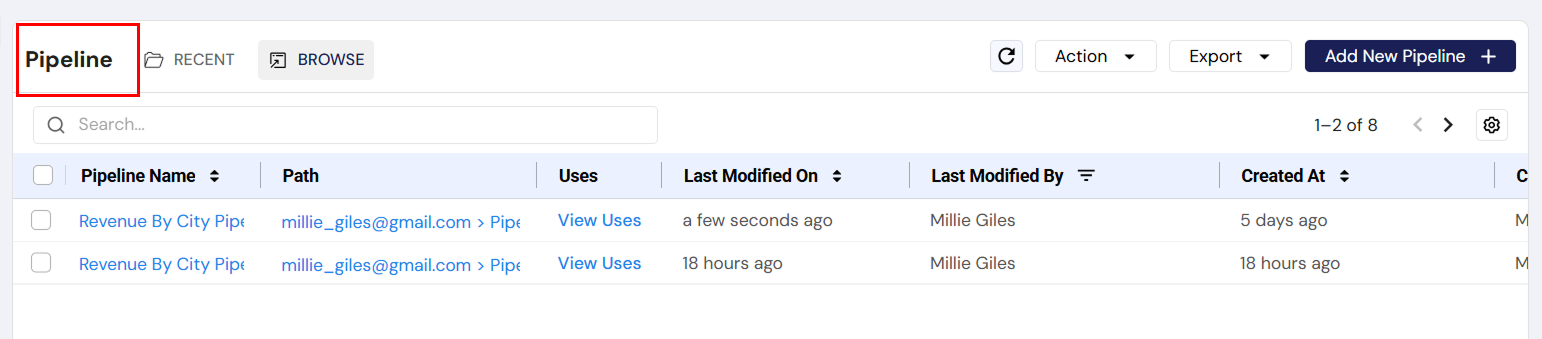
1. Pipeline List
- Purpose: The primary view for all the pipelines in the system, showing details like the pipeline name, its path, usage, and modification history.
- Components:
- Pipeline Name: Click to open and edit the specific pipeline's canvas (where users can modify the pipeline).
- Path: Click to view the pipeline's virtual location.
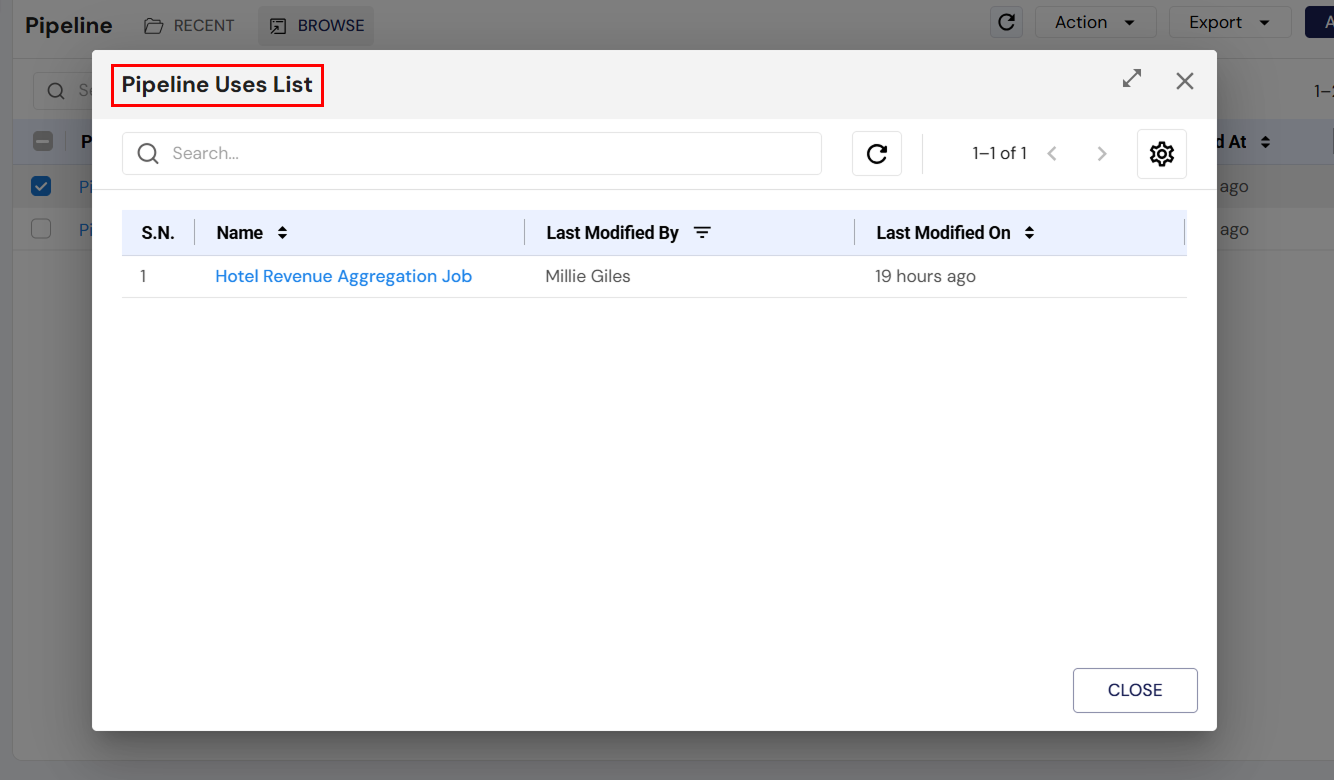
- Uses: Clicking "View Uses" shows a list of jobs that are using the pipeline. This helps in understanding the pipeline's dependencies.
2. Actions Dropdown
- Purpose: Allows users to manage pipelines by performing various actions.
- Available Actions:
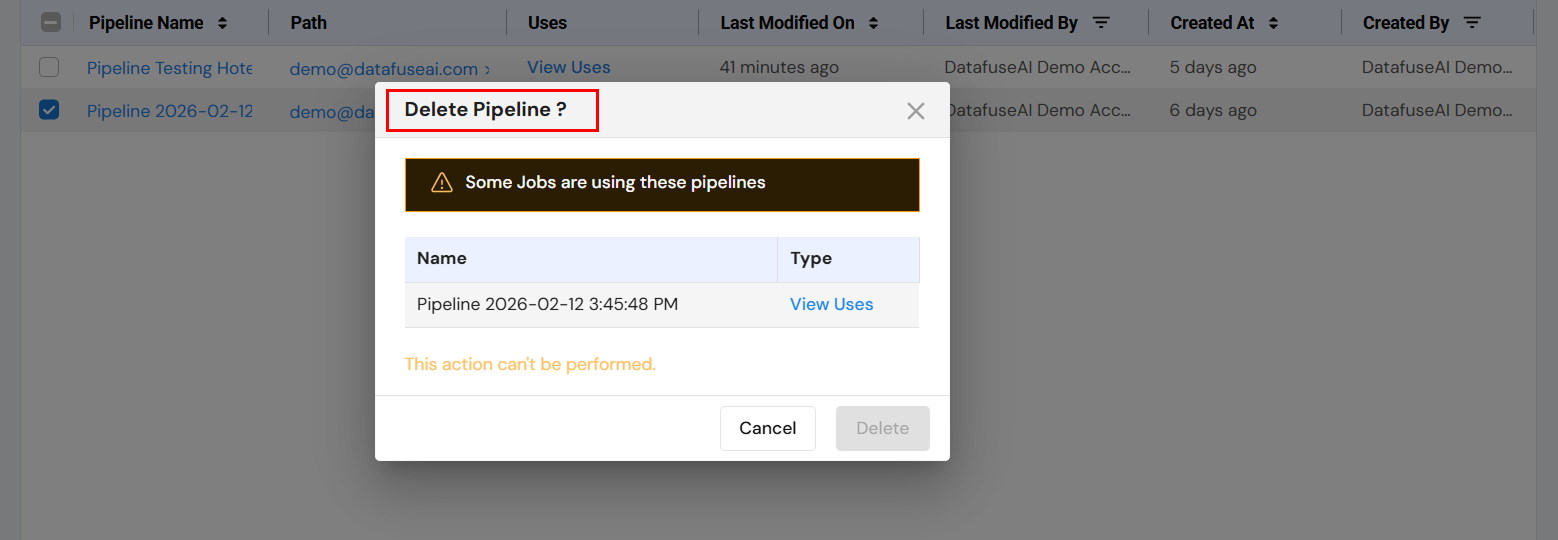
- Delete: Deletes the selected pipeline. If the pipeline is in use by any jobs, a warning is displayed, and the deletion cannot proceed.
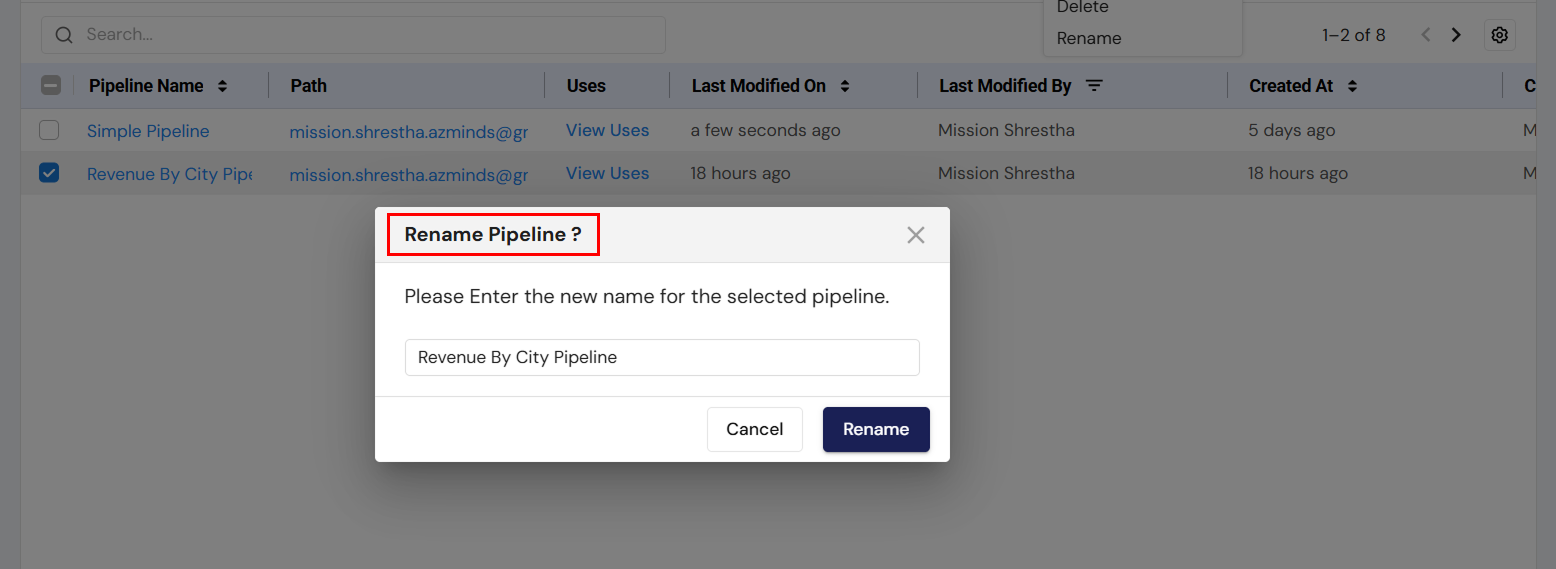
- Rename: Renames the selected pipeline. A prompt appears allowing users to enter a new name for the pipeline.
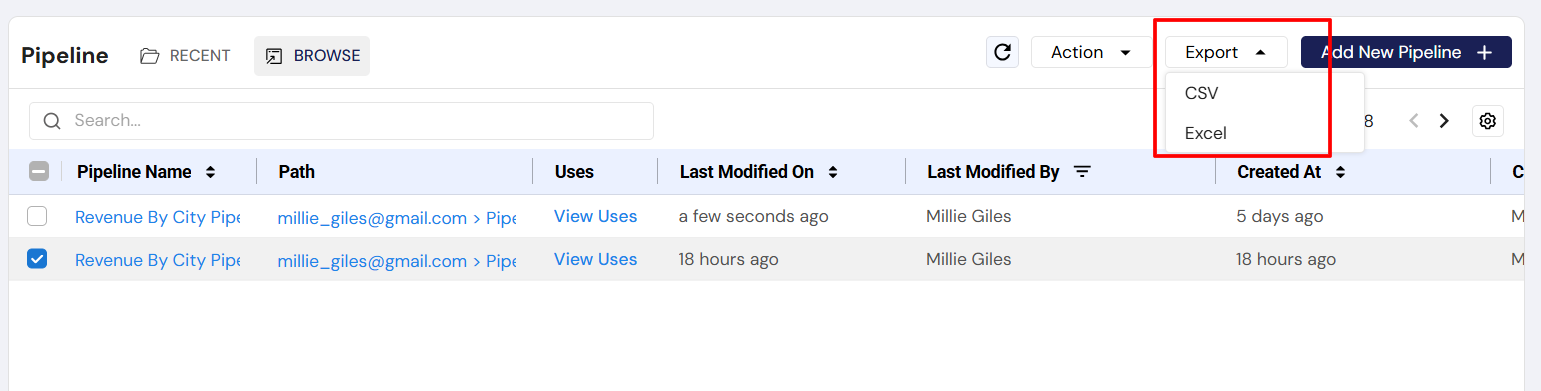
3. Export Options
- Purpose: Provides users with the ability to export the list of pipelines.
- Available Export Formats:
- CSV: Download the pipeline list in CSV format.
- Excel: Download the pipeline list in Excel format for further analysis or record-keeping.
4. Add New Pipeline
- Purpose: Allows users to create a new pipeline.
- Behavior: Clicking the "Add New Pipeline" button opens a new window with the pipeline canvas, where users can define the source, transformations, and sink for the new pipeline.
5. Search Functionality
- Purpose: Helps users quickly find pipelines by searching for their name or other attributes.
- Behavior: A search bar is available at the top of the pipeline list to filter through pipelines.
User Interactions & Workflow
Renaming a Pipeline
- Select a pipeline and click on the Rename option.
- A dialog box will appear, prompting the user to enter a new name for the pipeline.
- After entering the new name, the user can choose to Rename (to save the new name) or Cancel (to dismiss the changes).
Deleting a Pipeline
- Select a pipeline and click on the Delete option.
- If the pipeline is being used by any jobs, the user will be shown a warning with a list of jobs that are using the pipeline. Deletion cannot proceed unless the pipeline is not in use by any jobs.
- The user can either choose to Cancel or proceed with the Delete action (if there are no dependencies).
Exporting the Pipeline List
Users can export the pipeline list to a CSV or Excel file using the Export dropdown. This provides a way to download a static copy of the pipeline list for offline analysis or record-keeping.
Adding a New Pipeline
Clicking the Add New Pipeline button will redirect users to the pipeline creation page, where they can define a new pipeline's components, such as its source, transformation logic, and destination (sink).
Viewing Pipeline Usage
Clicking on the "View Uses" link under the Uses column allows users to see which jobs are currently using the selected pipeline, providing insights into the pipeline's dependencies within the system.
Navigation & Accessibility
- Navigation: The Pipeline Listing Section is accessible from the main left sidebar under the "Pipeline" tab.
- Tabs:
- Recent: Displays recently interacted pipelines.
- Browse: Shows all available pipelines in the system.
The Pipeline Listing Section is an essential interface for managing pipelines. It allows users to perform key actions such as renaming, deleting, and exporting pipelines, while also providing detailed usage insights and a streamlined interface for creating new pipelines. The section is designed to be intuitive, with quick access to critical actions and detailed views, making it easy for users to manage and monitor their pipelines effectively.
Individual Pipeline / Pipeline Run Instance Section
Overview
The Individual Pipeline/Pipeline Instance Section is a crucial part of a data pipeline management tool, enabling users to create, configure, and manage pipelines that process and transform data. Pipelines facilitate the ingestion of data from diverse sources, applying necessary transformations to refine and structure the data, and finally loading the results into predefined sinks. Additionally, the tool includes a profiling feature to help visualize data patterns and statistics, which supports data analysis and quality assurance.
Key Features
1. Source Integration
A Source is any external system or location from which data can be ingested into DataFuse AI. Sources include databases, cloud storage, file systems, and other data repositories. Connecting to a source allows you to pull raw data into the platform for analysis, transformation, and reporting.
All sources are configured using Connection Profiles that define authentication and connection parameters such as hostname, credentials, and database/schema details.
Supported Source Types
| Category | Drivers / Examples | Description / Use Case |
|---|---|---|
| RDBMS | MSSQL, Oracle, PostgreSQL, MySQL, Snowflake, Redshift, SAP HANA, Vertica, Teradata, MonetDB, CockroachDB, MariaDB, IBM DB2 | Relational databases with structured tables. Ideal for transactional or structured data. |
| NoSQL | BigQuery, Cassandra, Couchbase, MongoDB, Azure Cosmos NoSQL, Azure Cosmos MongoDB | Non-relational databases for flexible or schema-less data storage. |
| AWS | RDS MariaDB, RDS MSSQL, RDS MySQL, RDS MySQL Aurora, RDS Oracle, RDS PostgreSQL Aurora, RDS PostgreSQL, RDS IBM DB2 | Amazon Web Services–hosted databases and managed services. |
| Azure | Azure MySQL, Azure PostgreSQL, Azure SQL Server, Azure Cosmos PostgreSQL | Microsoft Azure–hosted databases and services. |
| S3 | S3 | Amazon S3 object storage for raw or processed data files. |
| FTP / SFTP | FTP, SFTP | File transfer protocol servers for ingesting files from external systems. |
| File | Upload | Direct file uploads such as CSV, Excel, or JSON files from local storage. |

Source Additional Settings
| Setting | Description |
|---|---|
| Fetch Size | Determines how many records are retrieved per batch from the source, helping optimize memory usage. |
| Packet Size | Specifies the size of data packets during transfer, improving performance for large datasets. |
| Column Name | Used for partitioning or specifying which column to use for incremental data ingestion. |
| Lower Bound | Sets the starting value for partitioning or incremental extraction to parallelize data ingestion. |
| Upper Bound | Sets the ending value for partitioning or incremental extraction to parallelize data ingestion. |
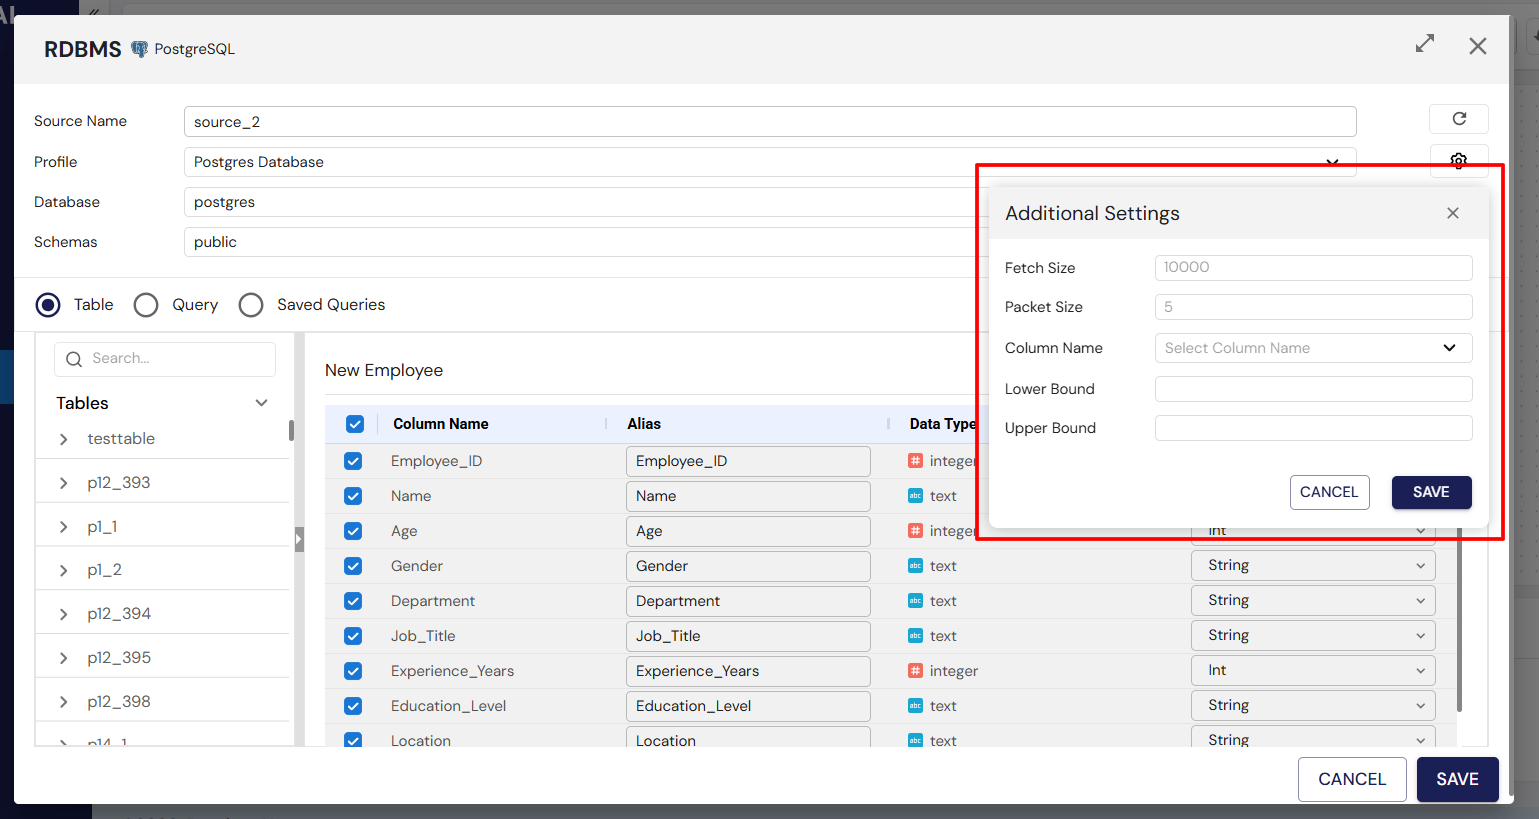
Using these additional settings helps optimize data ingestion for performance, efficiency, and targeted data extraction.
2. Transformations
A transformation is any operation applied to raw or ingested data to clean, reshape, or enrich it, making it more suitable for analysis, reporting, or AI workflows. Transformations can modify the structure, content, or aggregation of data.
| Transformation | Definition / Purpose | Typical Use Cases / Notes |
|---|---|---|
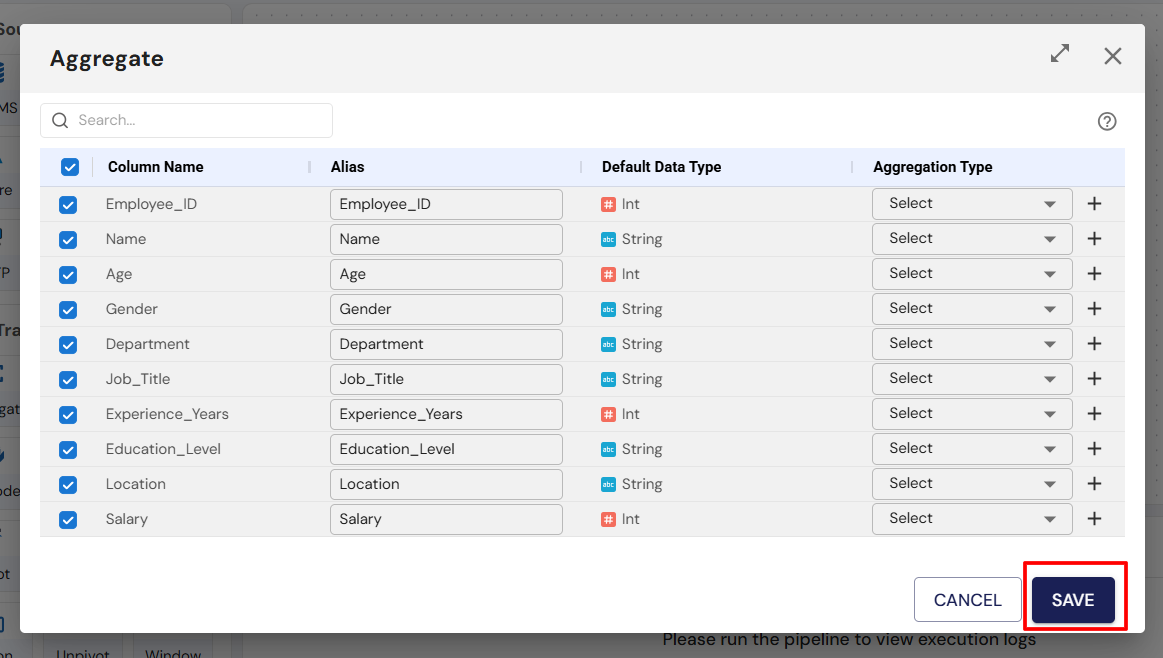
| Aggregate | Combines multiple rows into summary statistics such as totals, counts, averages, minimums, or maximums. | Calculate total sales per region, average salary per department, counts of unique customers. |
| Dedupe | Removes duplicate rows based on selected columns. | Clean datasets where repeated records exist. |
| Filter | Selects rows that meet specified conditions. | Isolate sales above a threshold, employees in a specific department, or recent transactions. |
| Pivot | Converts rows into columns for summarization. | Transform monthly sales data from long to wide format. |
| Unpivot | Converts columns into rows. | Convert wide datasets back into standard long format. |
| Join | Combines data from multiple tables based on keys. | Merge customer info with transaction history or employee details with department data. |
| Split | Divides a column into multiple columns using delimiters. | Split full names into first and last names or parse addresses into street, city, and postal code. |
| Union | Appends datasets vertically. | Combine sales records from multiple stores into a single dataset. |
| Route | Directs data to different workflows based on conditions. | Send high-value transactions to a special process workflow. |
| Derived | Creates new columns by applying formulas or transformations to existing columns. | Compute profit margin, concatenate names, extract year from date. |
| Explode | Flattens array or nested data into multiple rows. | Break down a list of purchased items into separate rows. |
| Window | Performs calculations across a set of rows relative to the current row. | Moving averages, cumulative sums, row rankings. |
Transformations are applied by dragging nodes onto the canvas and connecting them to the source or other transformations. Configuration is done by double-clicking the node.

3. Sinks
A Sink is any destination system where processed data is stored after transformations. Sinks enable output of cleaned, aggregated, or enriched data for reporting, analytics, or downstream workflows.
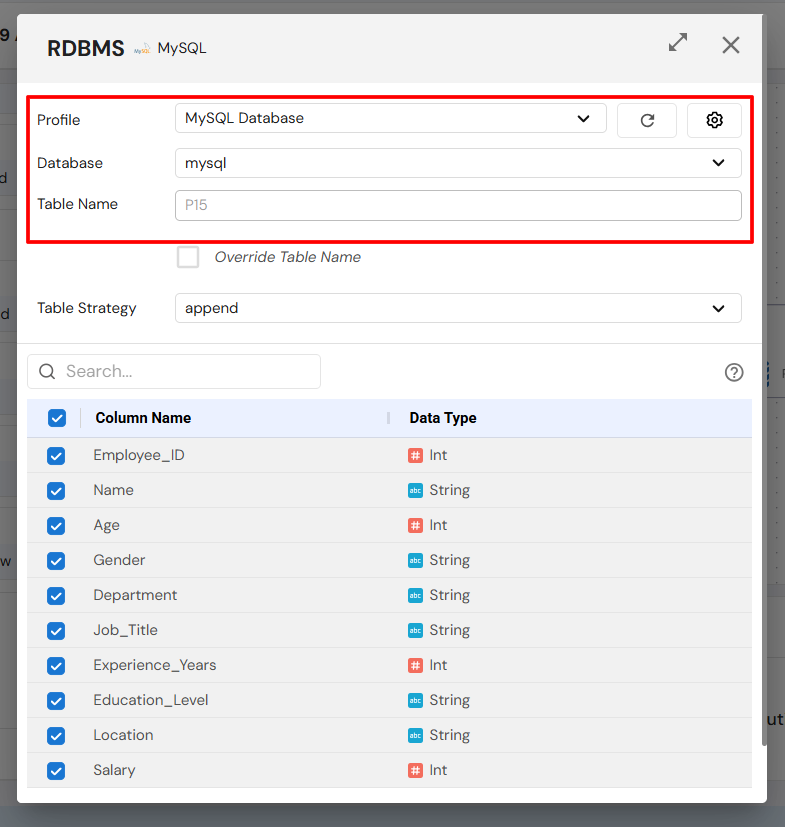
Currently, DataFuse AI supports relational databases (e.g., MySQL, PostgreSQL) as sinks. Sinks are configured via Connection Profiles.
Configuration Steps:
- Drag and drop the Sink node onto the canvas.
- Connect it to the Transformation node.
- Choose Connection Profile.
- Select Database, Schema, Table.
- Define Table Strategy:
- Create – Create a new table.
- Overwrite – Replace existing table.
- Append – Add to an existing table.
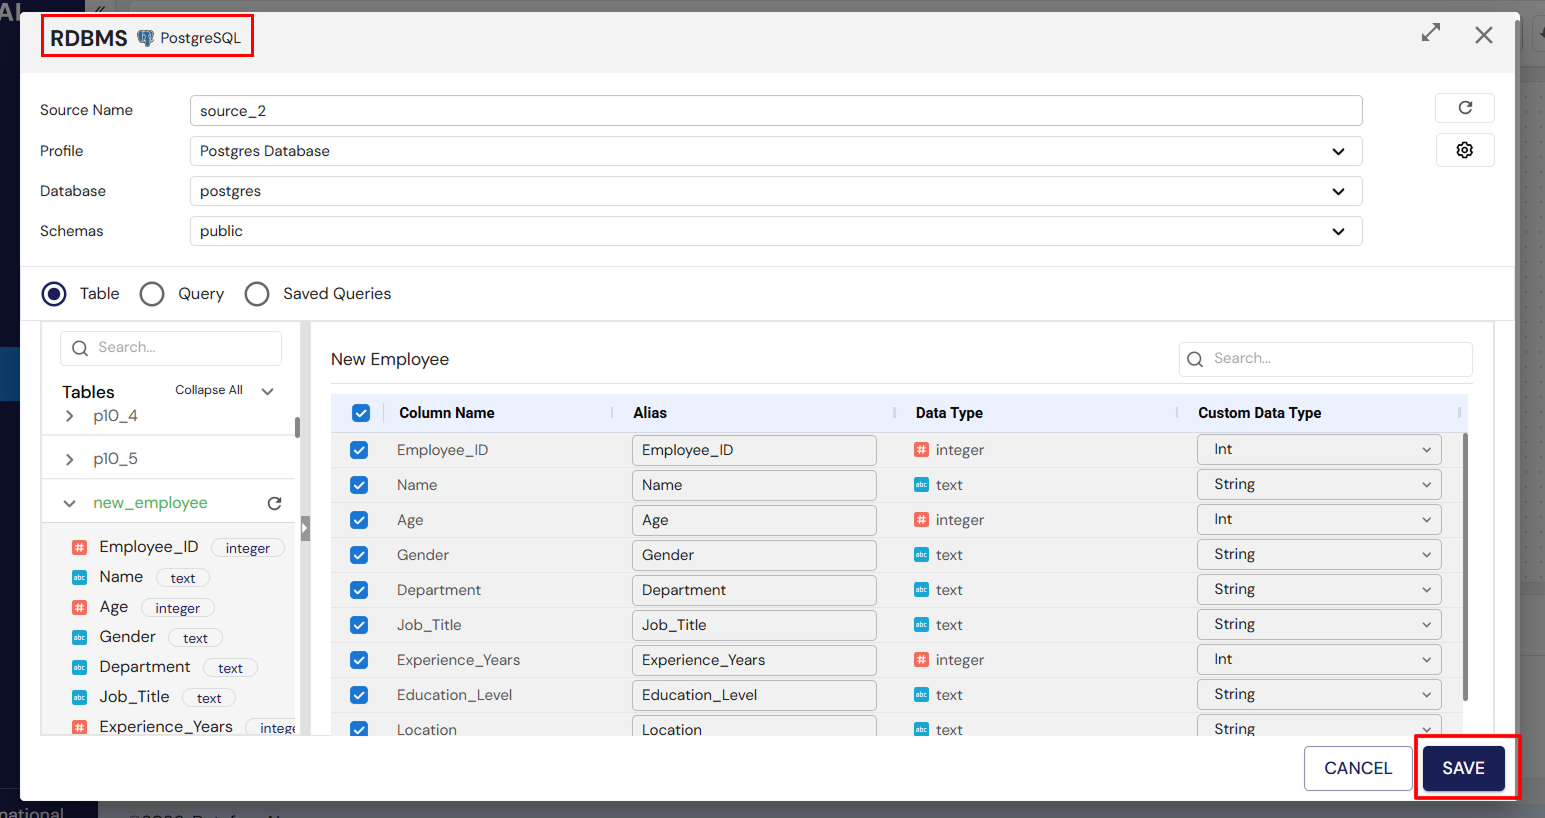
- Select columns to include and save configuration.

Sink Additional Settings
| Setting | Description |
|---|---|
| Batch Size | Number of records written per batch, optimizing performance and reducing network overhead. |
| Packet Size | Size of data packets during transfer to the sink, improving throughput for large datasets. |
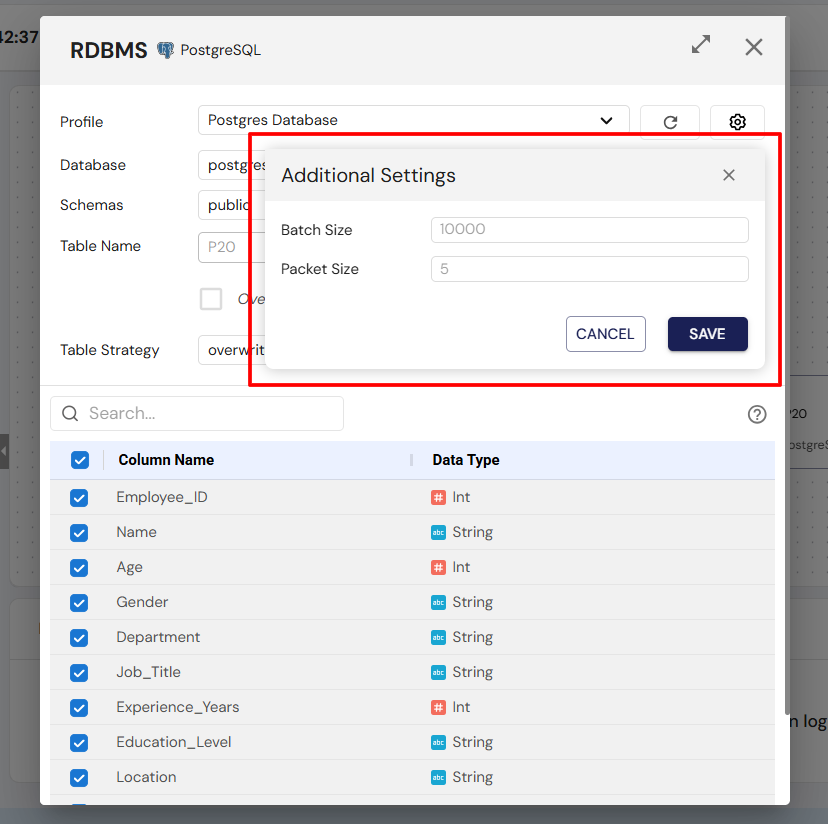
Configuring these settings helps optimize data writing for performance, reliability, and efficient use of system resources.
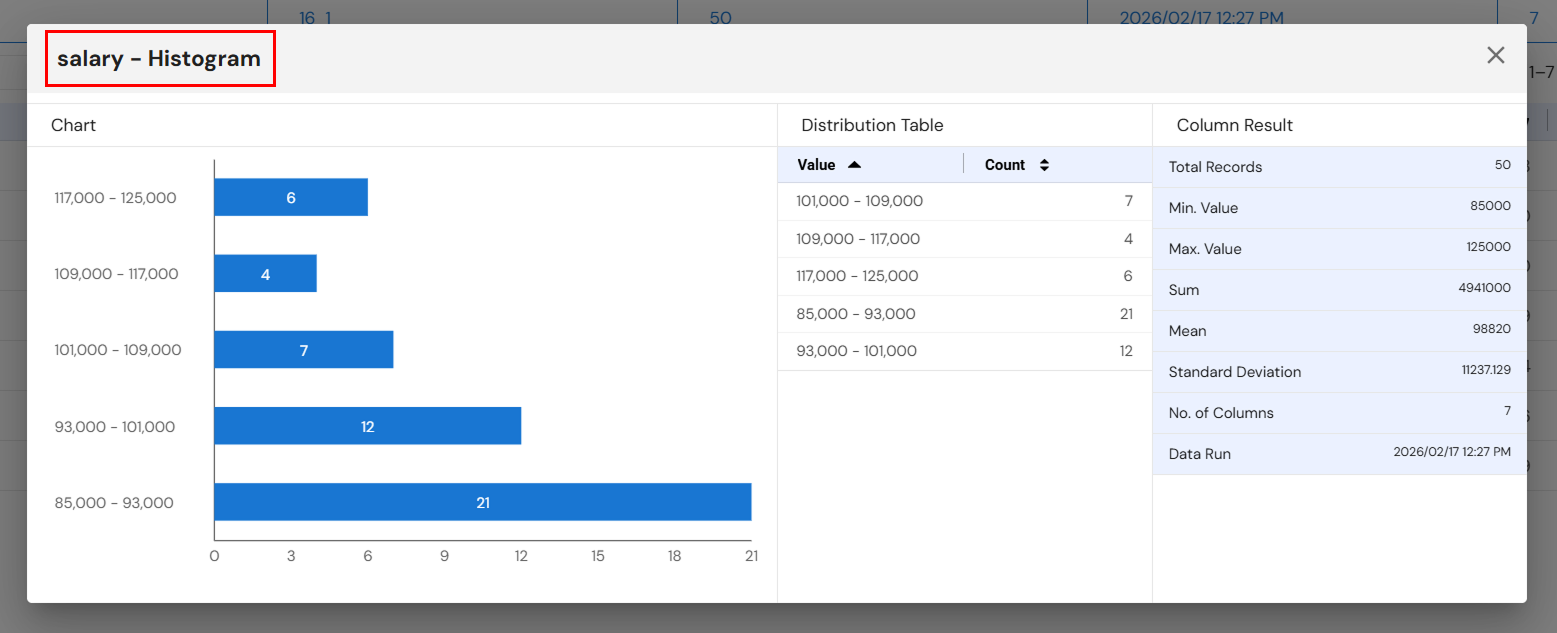
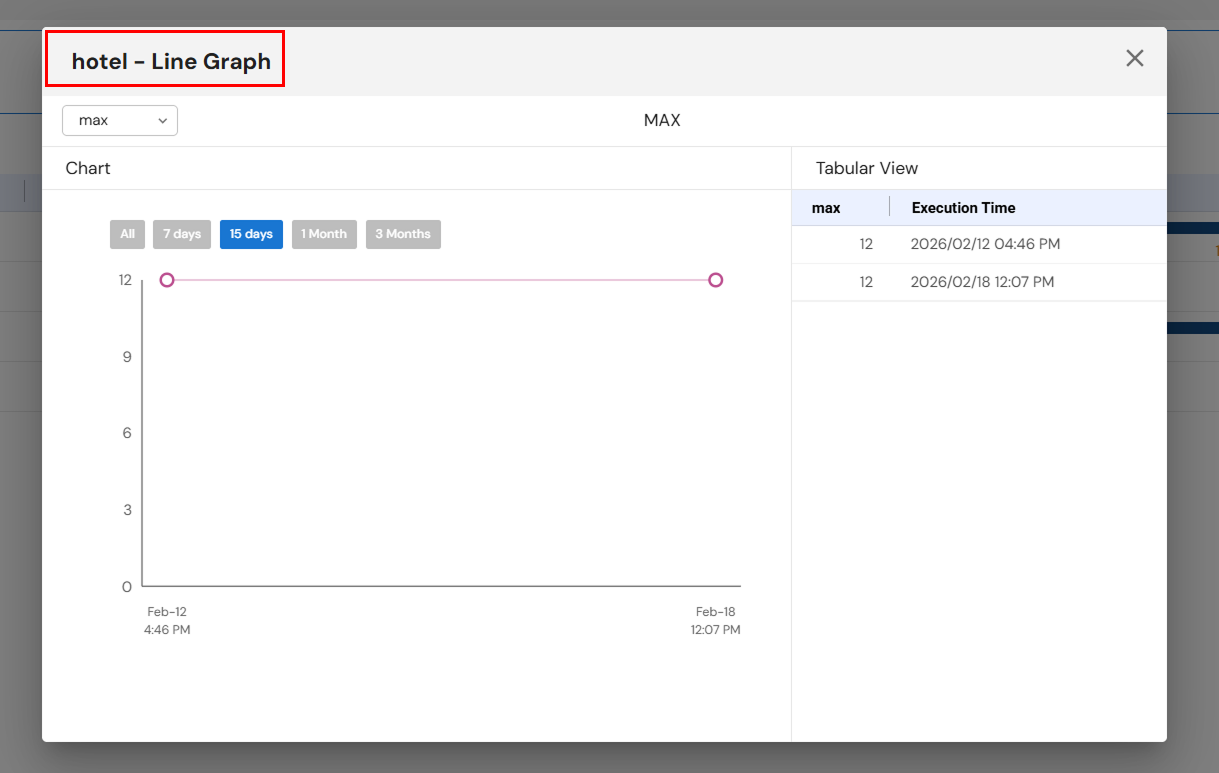
4. Profiling
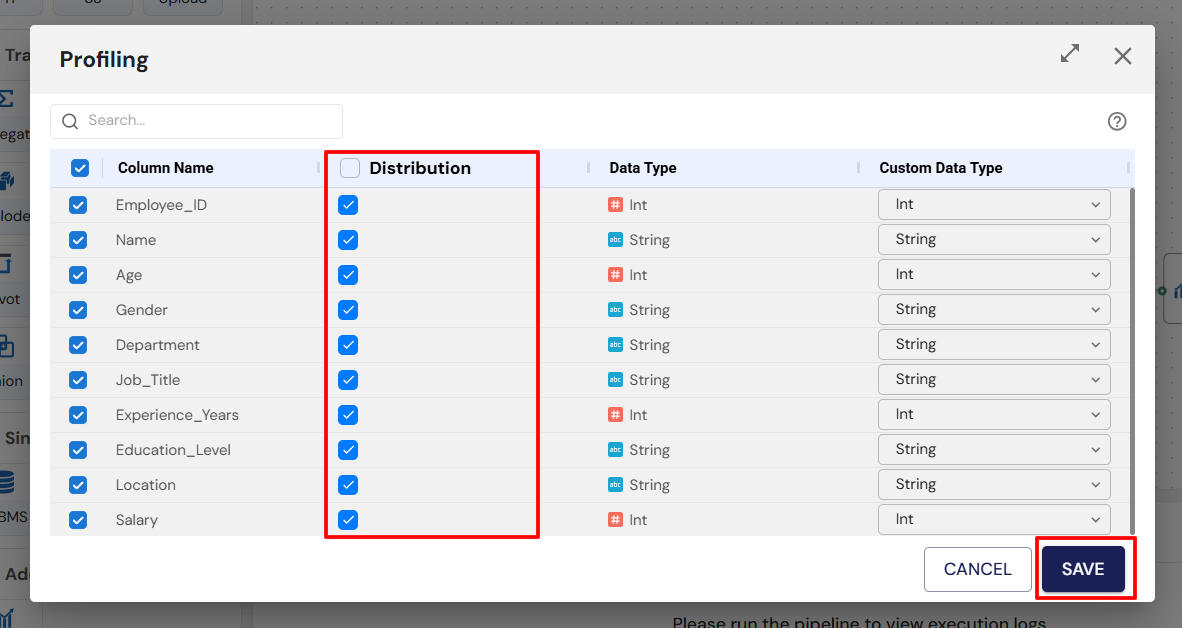
Data Profiling analyzes and visualizes data after it has been stored in the sink, providing insights into structure, quality, and content. Profiling helps identify patterns, anomalies, missing values, and statistical characteristics of the processed data.
Steps:
- Drag and drop a Profiling node onto the canvas.
- Connect it to the Sink node.
- Double-click the Profiling node to configure visualizations and settings.
- Save configuration and view insights.

5. Execution Monitoring
The system tracks the status of each step in the pipeline (ingestion, transformation, and insertion into sinks) and provides detailed logs, enabling users to monitor the pipeline's progress and troubleshoot issues.
6. Customization and Interactivity
The interface supports drag-and-drop functionality for creating and configuring pipelines. This feature makes it easier for users to set up pipelines without needing to write extensive code.
User Interactions & Workflow

Pipeline Creation and Configuration
-
Drag-and-Drop: The user can start by dragging the desired sources (e.g., PostgreSQL, MySQL, AWS S3), transformations (e.g., aggregate, filter, join), sinks (e.g., MySQL, PostgreSQL), and profiling components into the workspace.
-
Configure Components: Once placed, each component must be configured:
- Source Configuration: Users enter connection details using Connection Profiles (e.g., credentials, query, or table names).
- Transformation Configuration: Users define the transformation logic, such as specifying aggregation fields, filter conditions, or join parameters.
- Sink Configuration: Users define where the final processed data should be stored using Connection Profiles (e.g., MySQL database schema and table).
- Profiling Configuration: Users select which metrics (e.g., data distributions, null values) to visualize.
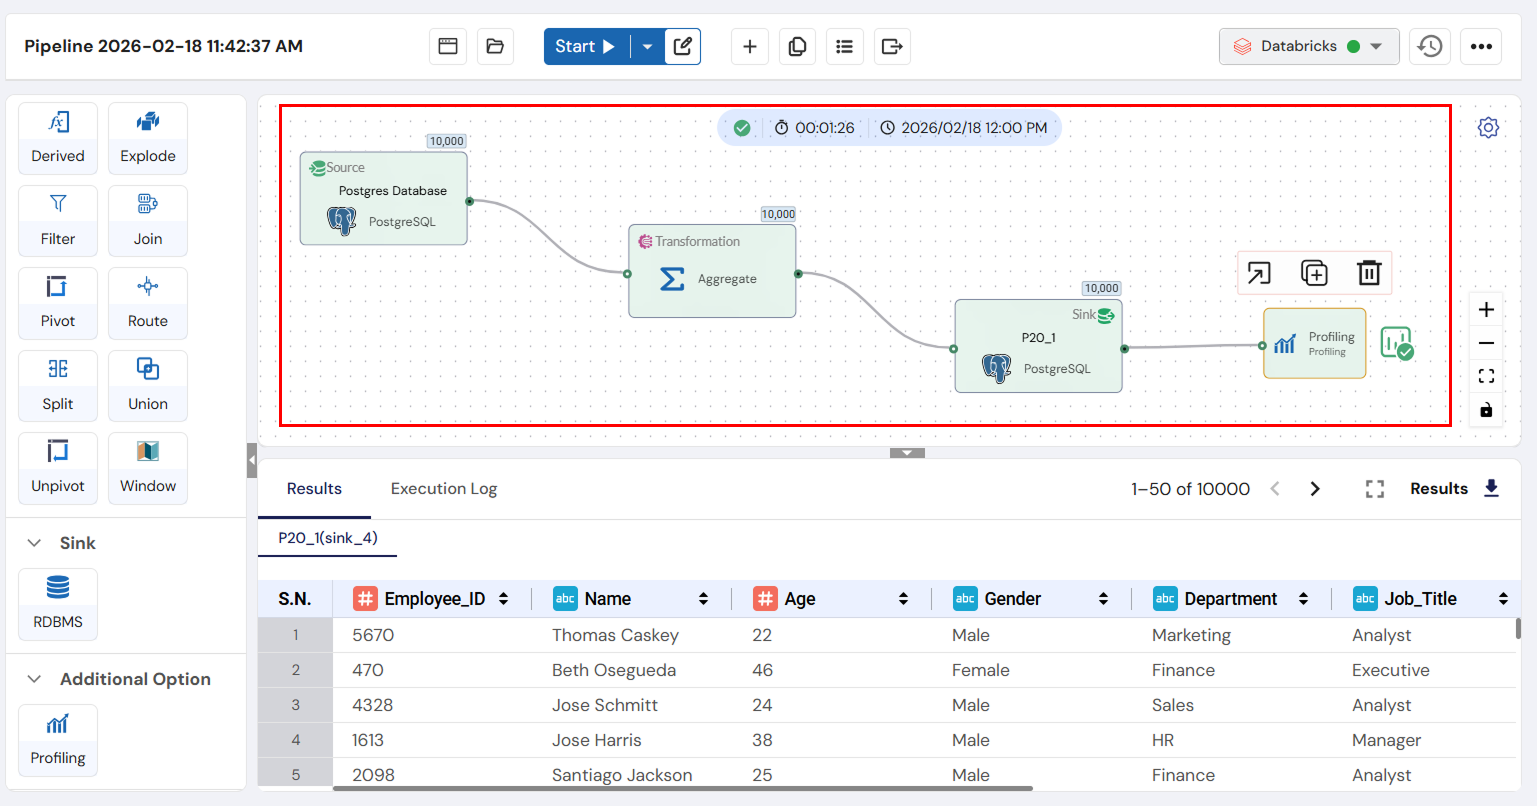
Start Pipeline Execution
Once all components are configured, users click Start to run the pipeline. This initiates the data flow: data is ingested from sources, transformed according to the specified logic, and written to the sink. The pipeline runs on the configured Engine.
Pipeline Monitoring
- During execution, users can monitor the pipeline's progress via the Execution Log, which details each stage of the process (e.g., ingestion, transformation, and insertion).
- Execution Logs show success/failure statuses and timestamps, enabling users to track performance and address any issues in real-time.
Additional Actions
- Duplicate Pipeline: Users can duplicate an existing pipeline by selecting Duplicate from the options. This allows users to make changes to a copy without affecting the original pipeline.
- Schedule Pipeline: Users can set a schedule for the pipeline to run at a specified time or interval using the Schedule dropdown. This creates a Job for automated execution.
- View Pipeline Uses: This option shows where and how the pipeline is being used across the system, particularly which Jobs are utilizing it.
- View Latest Output: Users can quickly access the most recent data output from the sink to verify the results.
- View Execution History: Users can access historical logs of previous pipeline executions, with details on run status, issues encountered, and any corrective actions taken.
- View Results: After the pipeline runs, users can view the processed data or download it for further analysis.
Navigation & Accessibility
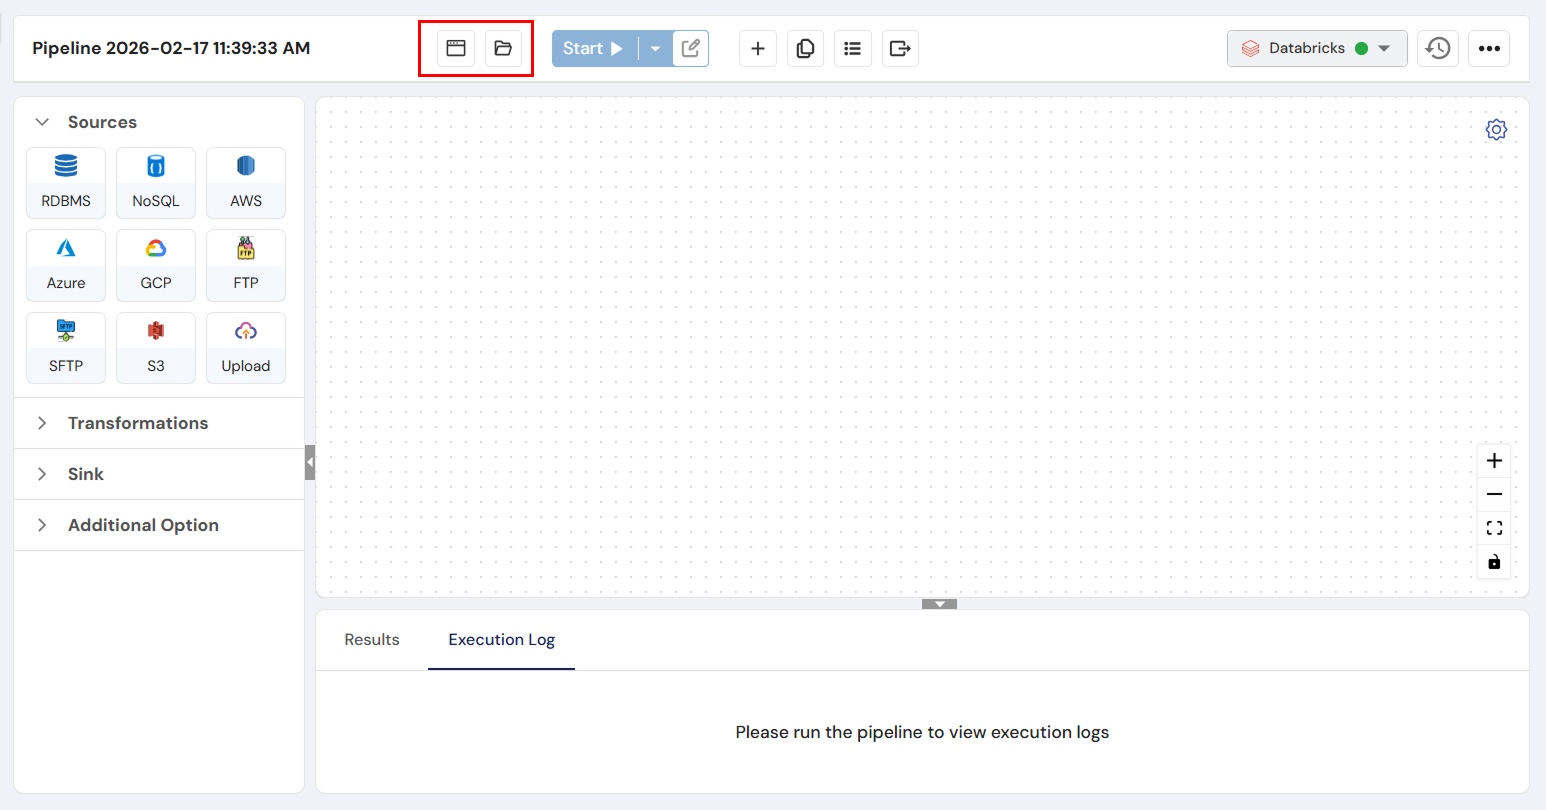
Top Bar
- Pipeline Name: Displays the default pipeline name (e.g., "Pipeline 2025-12-05 04:20:52 PM"), which can be customized.
- Recent: Quickly access recently interacted pipelines.
- Browse: Navigate through the list of all pipelines available in the system.
- Start: Initiates the execution of the pipeline on the selected Engine.
- Schedule Dropdown: Allows the user to schedule the pipeline to run at a future time, creating a Job.
- EDIT: Users can edit the pipeline configuration.
- Add New Pipeline: A plus icon (+) to create a new pipeline.
- Duplicate Pipeline: Makes a copy of the pipeline for further modifications.
- View Pipeline Uses: Displays where and how the pipeline is used in the system.
- View Latest Output: Provides access to the most recent output data inserted into the sink.
Engine
- Execution History: Logs of all previous pipeline executions.
- Three-Dot Menu: Offers options to view execution history, the latest sink output, settings, and share the pipeline with others.
Execution Log and Results
Displays detailed logs of each step during execution. Users can download results once the pipeline completes its execution.
Conclusion
The Individual Pipeline/Pipeline Instance Section empowers users to build, execute, and monitor data pipelines with ease. Its drag-and-drop interface simplifies pipeline creation, while robust features like execution monitoring, scheduling, and profiling ensure that users can track their data's journey from ingestion to transformation and storage. Combined with extensive source integration and transformation capabilities, this section provides everything needed for effective data pipeline management.
Next Steps:
- Automate your pipelines with scheduled execution using the Job module
- Write SQL queries against your data using the Query module
- Manage your data sources in the Connection Profile module
- Explore and manage uploaded files in the File Explorer
If you encounter any issues, refer to the Troubleshooting section or contact your support team for assistance.