Dashboard
1. Overview of the Module
1.1 Introduction
The Dashboard Module in DatafuseAI provides a centralized location for users to access a comprehensive overview of all major components within the system. By consolidating data from various system modules, it enables users to monitor the health, performance, and activity of key system features, such as Connection Profiles, Queries, Pipelines, Jobs, Recent Activities, and System Usage statistics. The Dashboard is the go-to place for administrators, engineers, and data analysts to quickly assess and respond to system performance, issues, and ongoing tasks.
Core Functionality:
- Monitor Connection Profiles: Track the status of data connections, including the latest connection test results.
- Observe Job and Pipeline Metrics: View historical performance metrics, such as success rates and failures over time.
- Query Tracking: Gain insights into the number of queries run on a particular day, estimating query usage.
- System Resource Usage: Visualize system resource utilization, such as CPU, memory, and disk space usage in real-time.
- Recent Activities and Runs: Stay up-to-date with the latest user activities and recent pipeline/job executions.
Purpose in the Ecosystem:
The Dashboard serves as the main interface for system monitoring and reporting within DatafuseAI, giving users quick access to essential operational metrics. It facilitates immediate action in case of any anomalies, providing a real-time snapshot of critical system components.
1.2 Why is it Important?
Significance:
The Dashboard is indispensable for maintaining the smooth operation of DatafuseAI. It provides users with essential insights into system performance, connection health, module status, and resource usage. Without a centralized monitoring system like the Dashboard, identifying and resolving issues across different system components would be time-consuming and prone to oversight. The Dashboard empowers users to:
- Increase operational efficiency by providing quick access to essential performance data.
- Proactively address issues by giving real-time insights into failing jobs, pipeline disruptions, or resource overuse.
- Optimize system performance by analyzing historical data and trends, allowing users to identify potential bottlenecks or underused resources.
Problems it Solves:
- Lack of centralized monitoring: Previously, monitoring various system components would require navigating through multiple modules or interfaces, leading to fragmented data and inefficient troubleshooting.
- Difficulty in identifying systemic issues: The Dashboard's ability to display aggregate data and trends helps users spot recurring problems (e.g., frequently failing jobs or pipelines) and address them before they escalate.
- Manual intervention: Automated metrics and alerts help reduce the need for constant manual tracking, giving users more time to focus on higher-level tasks.
1.3 Key Features in the Module
Feature 1: Connection Profile Overview
The Dashboard provides an in-depth view of all connection profiles in the system. Users can:
- Monitor active connections: See which connections are enabled, and easily check the status of each one.
- View the latest connection test results: Connection profiles are color-coded (green for success, red for failure) to quickly identify any connectivity issues.
Feature 2: Job & Pipeline Tracking
- Running Jobs: Track jobs that are actively running. The Dashboard displays a summary of the total number of jobs, highlighting those currently in progress.
- Failed Jobs: The number of failed jobs is prominently displayed, [here; count of the last five consecutive failed runs, indicating whether failures are recurring].
- Pipeline Health: View pipeline statuses and quickly identify any pipelines that have experienced repeated failures. The system aggregates pipeline failures monitoring to highlight recurring issues.
Feature 3: Real-Time System Stats
- Disk Usage: Visual graphs show disk usage over the last 60 days, indicating used space and available space, providing users with an at-a-glance view of storage trends.
- CPU and Memory Usage: Real-time system resource utilization is provided, including total core usage and percentage of resources consumed. This helps identify system performance bottlenecks.
Feature 4: Recent Activity Feed
Users can see a running history of recent system activities, including:
- Creation or modification of saved queries, pipelines, jobs, and connection profiles.
- Provides an audit trail for troubleshooting and understanding user behavior within the system.
1.4 Real-World Usage
The Dashboard module is crucial in various real-world scenarios, such as:
- System Health Monitoring: A system administrator monitors the dashboard every few hours to ensure that all connection profiles are active, jobs are running successfully, and no resources are being overused.
- Troubleshooting Pipeline Failures: A data engineer notices a repeated pipeline failure in the Dashboard and investigates the issue further, checking logs and re-running the jobs with adjusted configurations.
- Performance Optimization: An operations manager examines CPU and memory usage statistics over time to identify any spikes and optimize system performance accordingly.
The integration of the Dashboard into daily workflows ensures that users can act swiftly to resolve issues and maintain system stability.
2. Module Concepts
2.1 Connection Profiles
- Active Connection: Displays whether the connection profile is enabled or disabled. If disabled, users can enable it to restore connectivity.
- Connection Test Status: The Dashboard indicates whether the most recent connection test was successful, failed, or not checked.
Use Case:
- Example: If a user sees that a connection test has failed, they can quickly check the connection settings and attempt to reconnect or troubleshoot the cause of the failure.
2.2 Job and Pipeline Health
- Failed Jobs: When a job status fails, it’s recorded under "failed jobs". The Dashboard tracks jobs with a history of failed runs (last 5 attempts), providing a clear indication of recurring issues rather than one-time failures.
- Pipeline Failures: The system aggregates failed pipelines(failed in last 5 runs). This allows users to track pipelines that fail frequently over a set period.
Use Case:
- Example: A user sees that a particular pipeline is failing regularly, and by reviewing the job run history, they can identify patterns and take corrective actions.
2.3 System Usage
System stats usage is polled every 10 seconds
- Disk Usage: It shows both total used and available storage. This provides a real-time, historical view of the system's storage needs.
- CPU and Memory Usage: This data helps users monitor system performance and resource utilization, allowing them to detect potential issues that could cause performance degradation.
3. Module UI Components and User Actions
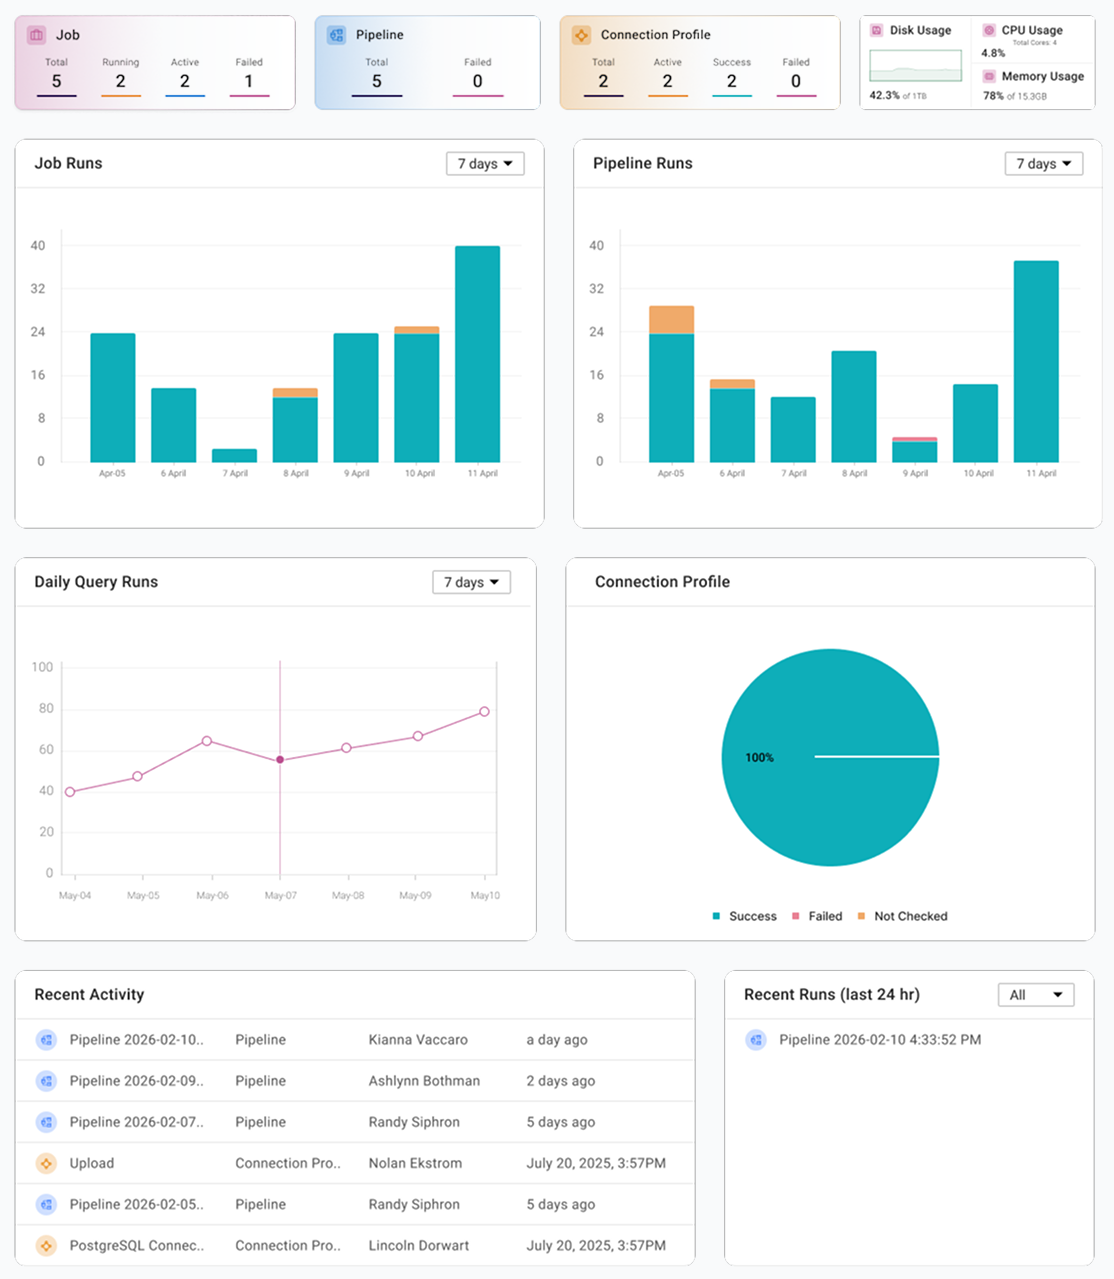
3.1 Dashboard Layout
UI Component 1: Job Box
- Total: Displays the total number of jobs in the system.
- Active: Displays the number of currently active jobs.
- Running: Displays jobs currently in progress.
- Failed: Displays jobs that have failed in the last 5 runs, indicating ongoing issues.
UI Component 2: Pipeline Box
- Total: Displays the total number of pipelines in the system.
- Failed: Displays the number of pipelines that have failed in the last 5 runs.
UI Component 3: Connection Profile Box
- Total: Displays the total number of connection profiles.
- Active: Displays the number of active profiles.
- Success: Displays the number of connection profiles with latest successful tests.
- Failed: Displays the number of profiles with latest failed connection tests.
UI Component 4: System Stats Box
- Disk Usage: Real-time display of system storage, including used and available space.
- CPU Usage: A real-time data showing CPU core and percentage of usage.
- Memory Usage: Real-time display of memory usage, including total memory used and available.
3.2 Recent Activity and Recent Run Tables
- These tables display a history of recent user actions and recent pipeline/job runs.
- Recent Activity Table: Shows user interactions with the system, such as creating or editing queries, connection profiles, pipelines, or jobs.
- Recent Runs Table: Displays the most recent pipeline or job executions
4. Standard User Flow
4.1 Check Dashboard for System Health and Overview of Modules
Upon opening the Dashboard, the user begins by evaluating the overall system health. This includes checking the status of active connections to ensure all data connections are operational. The user then reviews the status of jobs and pipelines, confirming they are running as expected or identifying any failures or issues that may require attention.
4.2 Investigate Failed Components
If any components, such as jobs, pipelines, or connections, are flagged as failed, the user can navigate to the corresponding modules for a deeper dive. Here, they can access detailed logs, error messages, and other relevant information to understand the root causes of the failures.
4.3 Act on Issues
With insights gathered from the detailed logs and failure data, the user proceeds to take corrective actions. These may include troubleshooting and reconnecting failed connections, optimizing or reconfiguring jobs, or addressing any recurring issues that may have contributed to the failures. The objective is to resolve the problems swiftly, ensuring continued system stability and performance.
6. Common Troubleshooting in the Module
6.1 Troubleshooting Tips
Issue: No Data Loaded in System When using the system for the first time, you may notice that no data is immediately available. This is expected behavior, as the system gradually populates data as you begin using it. Data starts to accumulate over time through activities such as running queries, executing jobs, and processing pipelines. As you continue interacting with the system, the data will be progressively filled and displayed, providing more insights and metrics.
7. Conclusion of the Module
7.1 Summary
The Dashboard module in DatafuseAI plays a critical role in ensuring the health, performance, and efficient operation of your system. It offers a comprehensive, at-a-glance view of essential system components, empowering users to quickly monitor key metrics, identify potential issues, and resolve them proactively. With its real-time data visualizations and insights, the Dashboard is an indispensable tool for maintaining optimal system performance and ensuring smooth operations.
8. What's Next After This Module?
8.1 Future Features
Looking ahead, future updates to the Dashboard module will likely include enhanced filtering capabilities for job and pipeline monitoring, deeper integrations with external tools for expanded functionality, and more granular notification settings to better align with user needs. These updates aim to provide even more flexibility and customization for users to tailor the Dashboard experience to their specific workflows.
8.2 Integration with Other Modules
For users seeking a more comprehensive experience, the Dashboard module seamlessly integrates with other core modules, such as Query Management and Data Processing. Exploring these modules will offer deeper insights and more powerful reporting features, further enhancing the overall utility of the Dashboard and enabling more informed decision-making.
8.3 Next Steps
To take full advantage of DatafuseAI’s capabilities, we recommend diving deeper into the Jobs and Pipelines sections. By configuring these components for optimal performance and exploring their advanced settings, users can significantly enhance system efficiency, streamline workflows, and ensure a more robust and stable environment.