Query
This comprehensive documentation is designed to provide non-technical users with an end-to-end, highly detailed, and step-by-step guide to mastering the DataFuse AI Query Module. Every feature, button, and workflow is covered to ensure you can confidently explore, manage, and analyze your data.
1. Introduction to the Query Module
1.1 Overview and Importance
The DataFuse AI Query Module is the powerful heart of your data exploration platform. It functions as a SQL Workbench or a data Integrated Development Environment (IDE), providing a central, high-performance area to write, execute, and manage SQL queries against your connected databases.
- What it does: It lets you ask questions of your data using the SQL language and presents the answers (the results) in a clear, organized table format.
- Why it's important: It is the primary tool for analysts, developers, and business users to access, audit, and understand the information stored in their company's databases, enabling data-driven decision-making.
1.2 Key Benefits
- Rapid Query Execution: Execute complex SQL queries quickly, supported by optimized distributed compute engines (like Databricks or Livy) configured in your Engine settings.
- Centralized Query Library: Save and reuse your most important queries, eliminating the need to rewrite them repeatedly.
- Full Historical Record: Every query you run is automatically logged with its execution time and status, providing a complete audit trail of your data activity.
- Intuitive Schema Browsing: Easily navigate through your database structure (databases, schemas, and tables) without needing to memorize every name.
- Simple Data Export: Get your query results out of the platform and into reporting tools (like spreadsheets) with a single click.
1.3 Use Cases (Real-World Examples)
| Scenario | Goal | How the Query Module Helps |
|---|---|---|
| Marketing Analysis | Determine total sales from customers acquired in the last month. | Write a custom SELECT ... JOIN ... WHERE query, execute it, and save it for reuse in future reporting cycles. |
| Ad-Hoc Reporting | Provide the CEO with the top 50 highest-paid employees immediately. | Use the Table Browser to auto-generate a query like SELECT * FROM employee ORDER BY salary DESC LIMIT 50, then run and export the results instantly. |
| Debugging | Investigate incorrect values appearing in a business report. | Locate the faulty SQL inSaved Queries, open it in the Query Editor, adjust the logic, and validate the corrected results in real time. |
2. How to Use the Query Editor: End-to-End Workflow
The Query Editor is the primary workspace where you interact with your data. This section walks you through the comprehensive process of connecting, writing, running, and analyzing a query.
2.1 Step-by-Step Instructions: Running Your First Query
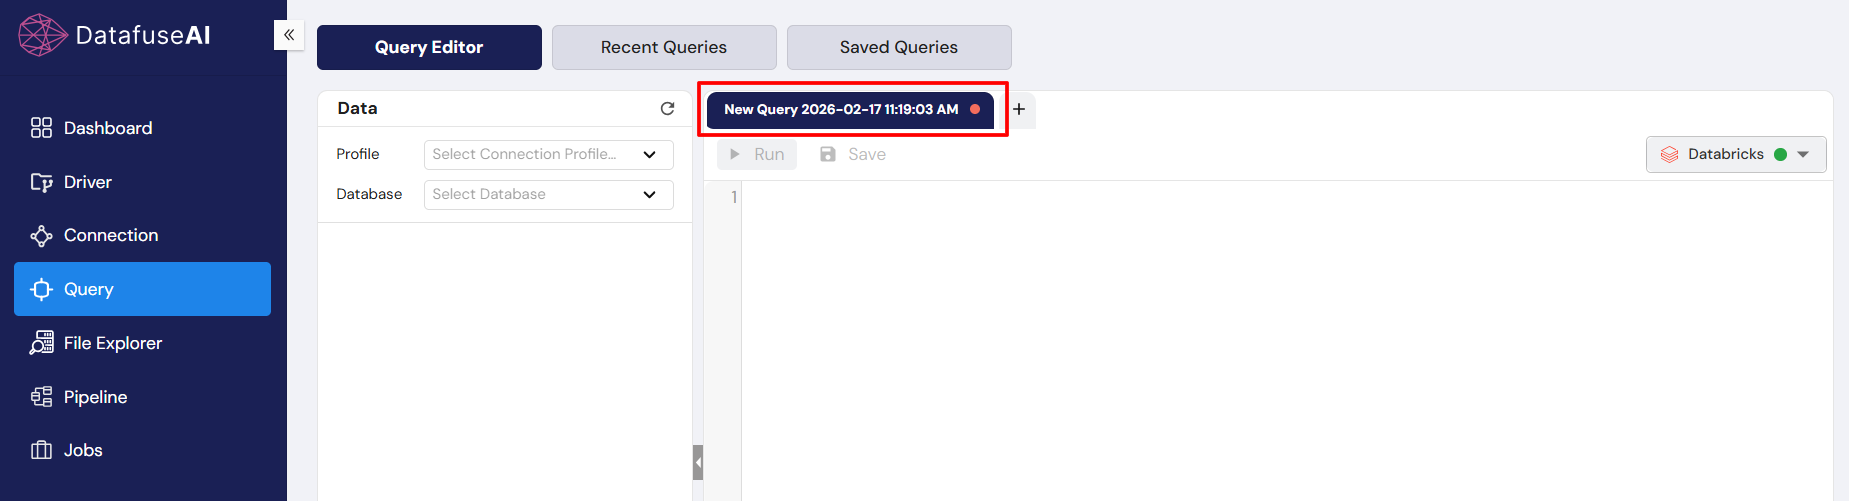
Step 1: Access the Query Module and Set the Connection
- In the Global Sidebar (far left), click on the Query icon to open the module.
- In the Data Connection Panel (left sidebar), use the dropdowns to establish your connection context. You must select:
- Profile: Choose a database connection (e.g., PostgreSQL-Connection-Profile).
- Database: Select the target database (e.g.,
test). - Schema: Select the schema (e.g.,
public).
Expected Input: Selection from pre-populated dropdown lists.
Expected Output: The Tables list below will populate with the structures available in that selected schema.
Step 2: Write Your SQL Query
- The SQL Editor is the large central area. You can write your own SQL query here.
- For example, type:
SELECT * FROM public.employee LIMIT 50 - Tip: The editor provides syntax highlighting (colors and formatting) to make your SQL easier to read and spot errors.
- Tip: You can open multiple queries simultaneously using the New Query tab (+ button).
Expected Input: A valid SQL statement.
Expected Output: Formatted SQL text in the editor.
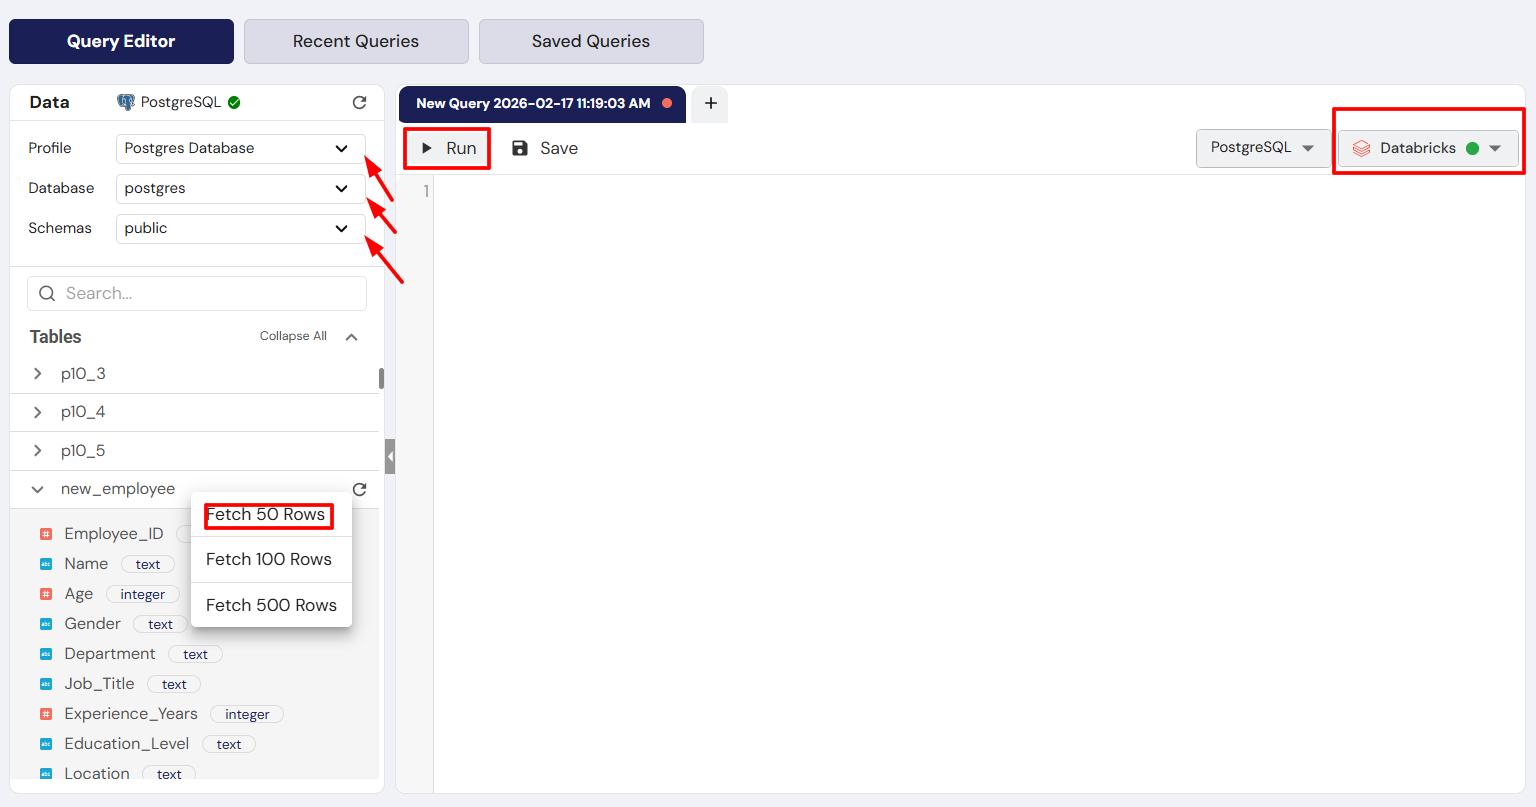
Step 3: Execute the Query
- Locate the toolbar above the SQL Editor.
- Click the Run button.
Expected Input: Clicking the Run button.
Expected Output: The query is sent to the database via the configured Engine. The Status Indicator in the Results Panel will change to Processing momentarily. If the query takes too long, you can click Stop.
Step 4: Analyze the Results
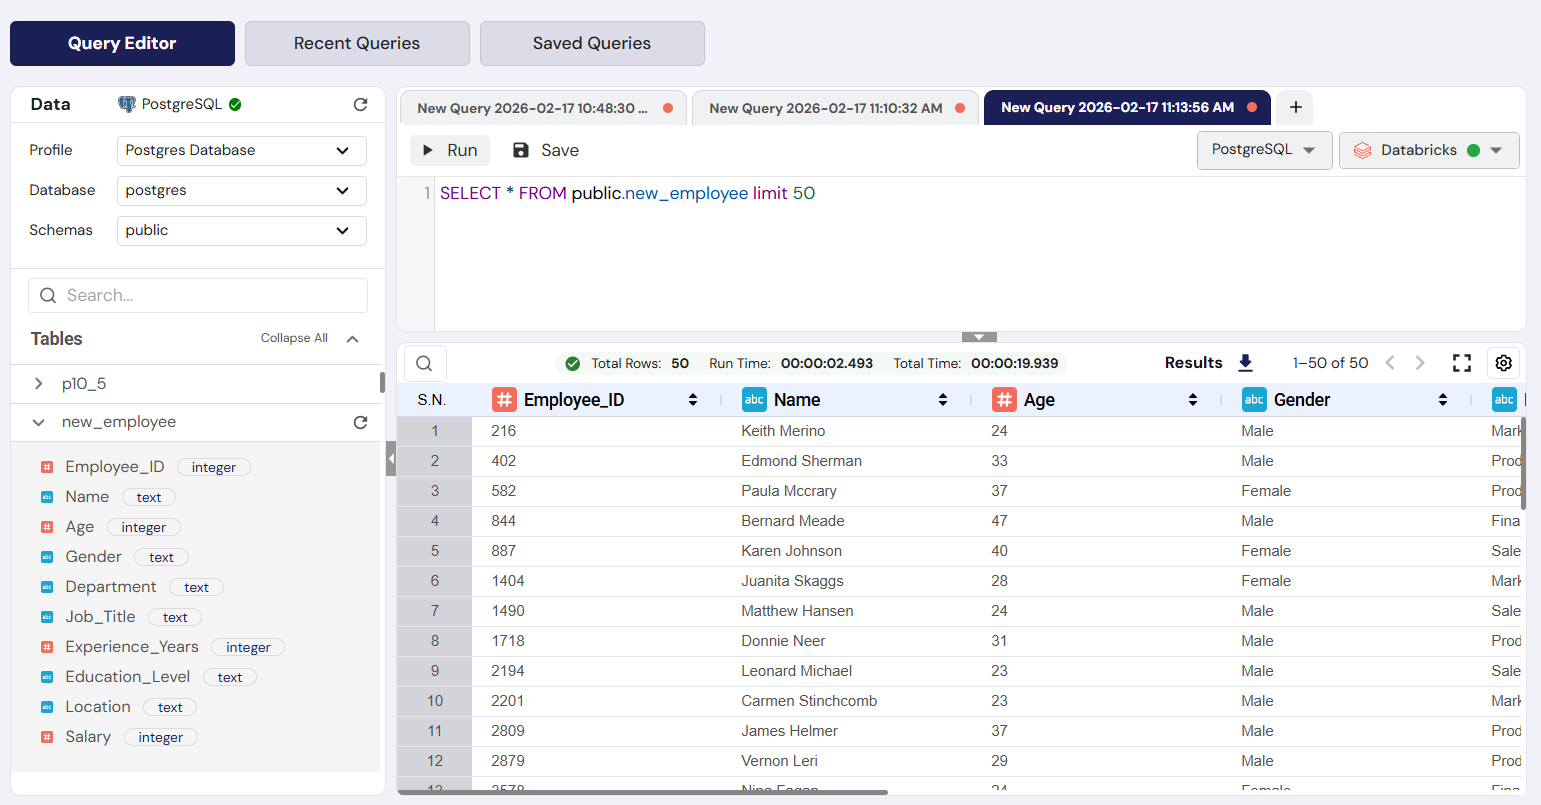
- Once the execution is complete, the Results Panel (bottom half) will display the data in a table format called the Result Grid.
- Review the metrics above the grid:
- Total Rows: The number of records returned (e.g., Total Rows: 50).
- Run Time: How long the query took to complete (e.g., 00:00:24:180).
- You can click on any column header (#employee_id, first_name, etc.) to sort the results.
Expected Input: Successful query execution.
Expected Output: A grid displaying data with columns corresponding to your query (e.g., employee details).
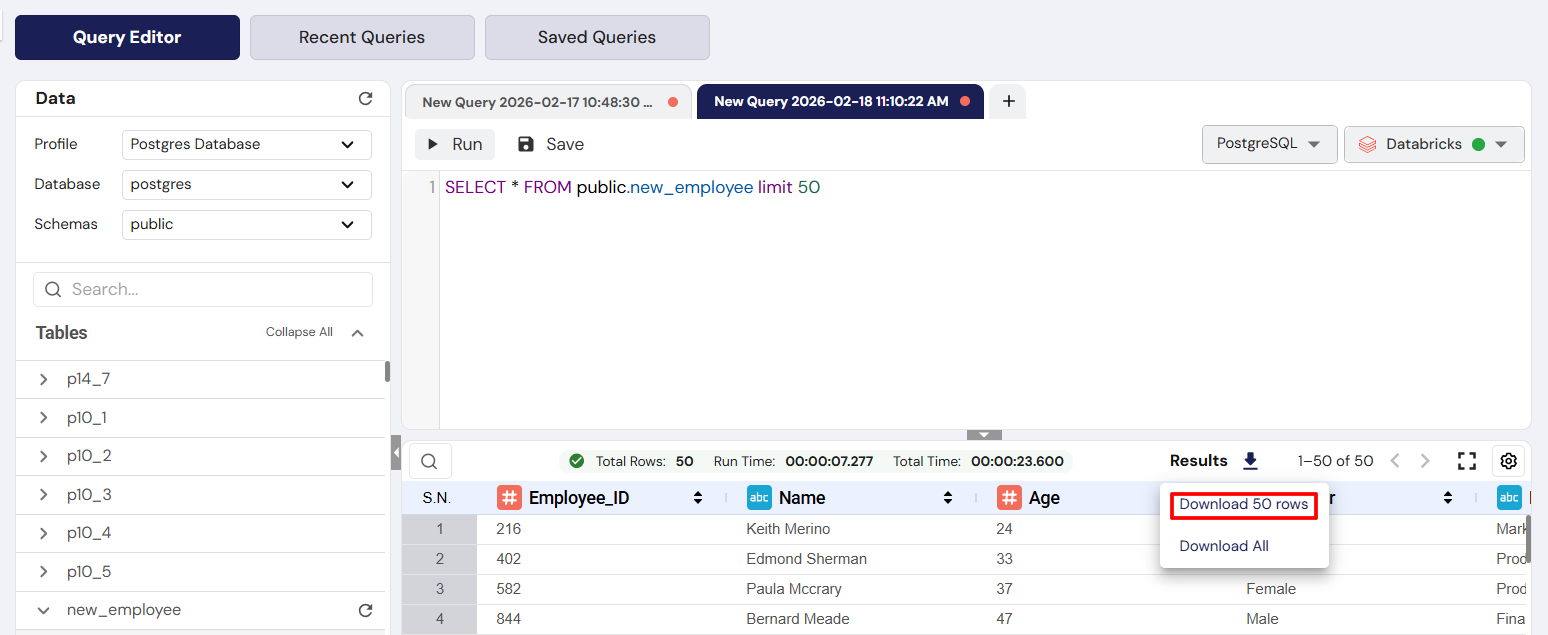
Step 5: Export the Results
- To share the data or analyze it outside of DataFuse AI, click the Results icon (usually a downward arrow/box) located above the results grid.
Expected Input: Clicking the Results button.
Expected Output: A file containing the query results is downloaded to your computer.
2.2 Real-Life Example: Quick Data Preview (The "No Coding Required" Flow)
Imagine you are an HR manager who needs to quickly verify the structure and a few sample records from the employee table without writing any SQL.
- Connect: Ensure the correct Profile, Database, and Schema are selected (e.g., PostgreSQL-Connection-Profile, test, public).
- Search: In the Data Connection Panel, type
empinto the Search bar to quickly filter for the employee table. - Right-Click & Preview:
- Right-click on the employee table name in the Tables list.
- A context menu will appear with options like Fetch 50 Rows, Fetch 100 Rows, and Fetch 500 Rows.
- Select Fetch 100 Rows.
- Automatic Generation: The system will automatically populate the SQL Editor with the query:
SELECT * FROM public.employee LIMIT 100;. - Run & View: The query is immediately executed, and the first 100 records of the table are displayed in the Results Panel.
3. Comprehensive User Actions
3.1 Action 1: Saving a Query
This action permanently stores a useful query so you don't lose it when you close the tab.
- Write and Run your query in the Query Editor.
- Click the Save button in the toolbar (next to the Run button).
- The Save Query Modal appears with the following fields:
- Query Name (Required): Give it a clear name (e.g., "Frequently Useful PostgreSQL Employee table Query").
- Query description (Optional): Explain the query's purpose (e.g., "This Query is used to view 100 records from employee table").
- Path: This is the virtual folder where your query will be stored for organization.
- Preview SQL query: This is a read-only field that confirms the SQL you are saving.
- Click the final Save button.
Why it's important: It builds your Saved Queries library, a reusable asset for your daily work.
3.2 Action 2: Deleting Queries from History
This action allows you to remove unnecessary or failed test queries from your historical log.
- Navigate to the Recent Queries tab.
- Select one or more queries by clicking the checkbox next to the Execution ID.
- Click the Delete button in the toolbar above the table.
- A Delete Confirmation box will appear: "Are you sure you want to delete?".
- Click the Delete button in the confirmation box.
Why it's important: Keeps your history log clean and manageable for auditing purposes.
3.3 Action 3: Filtering the Saved Queries Log
This is critical for auditing and finding a specific query you saved in the past.
- Navigate to the Saved Queries tab.
- Click the Date Filter button in the toolbar.
- A dropdown menu appears with preset options:
- Today: Shows all queries run since midnight.
- Last 3 Days: Shows queries from the last 72 hours.
- Last 7 Days: Shows queries from the last week.
- Last 15 Days: Shows queries from the last two weeks.
- Custom Range: You can also manually select a Start Date and End Date using the calendar icons.
- After selection, click APPLY CUSTOM RANGE to update the list.
Why it's important: Allows you to quickly find saved queries within a defined timeframe.
3.4 Action 4: Exporting Query Logs for Auditing
This allows you to download a record of your executed queries, not the data results themselves.
- Navigate to the Recent Queries tab or the Saved Queries tab.
- Click the Export As button in the toolbar.
- Select the desired format: CSV or Excel.
Why it's important: Provides a verifiable log of when queries were executed (Recent Queries) or which standardized queries are available (Saved Queries) for external reporting or compliance.
4. Navigating Through the DataFuse AI Query Module
4.1 Tabs and Structure
The Query Module is divided into three distinct, top-level tabs, each serving a unique purpose:
- Query Editor: The operational hub for live work. This is where you connect to databases, write code, and see live results.
- Recent Queries: The archival hub. This tab tracks the query execution history and metrics of every query run (time, status).
- Saved Queries: The knowledge hub. This tab acts as a permanent library for your standardized and most useful SQL scripts.
4.2 Navigation Instructions
- Switching Tabs: Simply click on the title of the tab you wish to access (e.g., click Saved Queries to view your stored scripts).
- Inter-Tab Workflow:
- To Re-run a Query from History or Saved: Click on the row of the query in the Recent Queries or Saved Queries tab. The system will automatically open it in a new Query Editor tab, ready to be run or modified.
- To Edit a Saved Query: Find the query in Saved Queries, click it, and the SQL will load into a new editor tab where you can make changes and click Save again (which may prompt you to save it as a new version or overwrite the existing one).
5. User Interface Elements (The Details)
5.1 UI Element 1: The Data Connection Panel (Left Sidebar)
This panel manages the metadata of your database connection.
- Functionality: Ensures your query is running against the correct server, database, and part of the database (schema). It also lets you browse the available tables.
- Interaction: Use the dropdown menus to select your context. Use the magnifying glass/Search bar to quickly locate tables. Click the Refresh Button (circular arrow) to reload the table list if you know a new table was recently added to the database.
Note: The connection profiles shown here are configured in the Connection Profile module and use Drivers to establish connectivity.
5.2 UI Element 2: The SQL Editor Control Toolbar
This small, yet powerful, bar above the code area contains your primary query control functions.
| UI Element | Functionality | How to Interact |
|---|---|---|
| Engine Selector | Dropdown that selects the Compute Engine (e.g., Livy, Databricks). | Select the engine that matches your requirement for connected profile. Configure engines in theEngine module. |
| Run Button | Executes the SQL code in the editor. | Click once to start query execution. |
| Stop Button | Interrupts a long-running query that is stuck in Processing. | Click once if the query is taking too long to prevent database resource exhaustion. |
| Save Button | Saves the current query to the Saved Queries library. | Click to open the Save Query modal (as described in3.1). |
5.3 UI Element 3: The Results Panel Metrics and Paginator
When a query succeeds, the bottom panel provides more than just the data table.
- Functionality: Provides immediate feedback on query efficiency and controls for navigating large datasets.
- Total Rows & Run Time: These metrics (e.g., Total Rows: 50 | Run Time: 00:00:24:180) give you performance feedback. A long run time suggests the query might need optimization.
- Pagination Controls: If your query returns thousands of rows, the system will only display a small portion (e.g., 50 rows) at a time. The controls (like
<and>arrows and the1-50 of 50counter) let you move between pages of results. - Interaction: Click the arrows to navigate pages. The dropdown next to the counter often lets you adjust the number of rows displayed per page.
6. Detailed Query Management and Logic
6.1 Understanding Query Statuses
When you run a query, the Status field (in Recent Queries) or the Status Indicator (in the Results Panel) will display one of these states:
- Success (Green): The query executed fully without any errors. Note: A success status does not mean the query returned data, only that the database understood and processed the request.
- Processing (Blue): The query has been sent to the database and is currently being executed. This status will remain until the query is either complete or stopped.
- Failure/Error (Red): The query could not be completed, usually due to a syntax error (a typo in your SQL), a permission issue, or a network problem. You will see an accompanying error message in the Results Panel.
- Timeout (Orange/Yellow): The query took too long (more than ~30 mins) due to resource unavailability or some issues. To protect the system from prolonged processing, queries are set to timeout.
6.2 The Anatomy of a Saved Query Record
The Saved Queries tab is not just a list of SQL code; it is a repository of metadata that makes the queries useful.
| Data Grid Column | Non-Technical Description | Importance |
|---|---|---|
| Query Name | The user-friendly title you gave the query. | Quick identification. |
| Query | A preview of the SQL code itself. | Allows you to check the code without opening it. |
| Path | The virtual folder where the query is organized (e.g., mission.shrestha.azminds.../Saved Query). | Helps categorize and manage large numbers of saved queries. |
| Connection Profile | The name of the database connection this query was originally saved against. | Ensures you run the query against the correct database in the future. Links toConnection Profile settings. |
| Created By | The username (Tenant) of the person who saved the query. | For auditing and collaboration purposes. SeeTenant User & Groups for user management. |
| Created At | The timestamp (date and time) when the query was saved. | Useful for filtering and version control. |
7. Troubleshooting and Support
7.1 Issue 1: "No Result Available" Error
Description: The Results Panel is empty and shows a message like "No result available. Please run the query to view the results."
Root Cause: The query was closed, or it executed successfully but returned zero rows (e.g., the filter condition was too strict).
Solution:
- Check Status: Look at the Recent Queries tab. If the status is Success, your query executed fine but found no data.
- Re-run: If you just opened the query tab, click the Run button again to fetch the data.
- Check SQL: If you expected data, double-check your SQL's
WHEREorJOINclauses for typos or incorrect logic.
7.2 Issue 2: Syntax Error (Red Text)
Description: The query fails, and the Results Panel shows a red error message indicating a problem with the SQL code itself (e.g., "ERROR: syntax error at or near 'emploee'").
Root Cause: You have misspelled a command (SELCT instead of SELECT), a table name (emploee instead of employee), or violated a rule of the SQL language for the selected Compute Engine (e.g., PostgreSQL, Databricks).
Solution:
- Read the Error Message: The error message usually points to the exact line or word that caused the problem. Correct the typo in the SQL statement.
- Verify Table and Column Names: Double-check the spelling of table and column names against the Data Connection Panel (where you can see all available tables and columns).
- Check the SQL Syntax: If the error mentions incorrect SQL syntax, consult the documentation for the SQL dialect you are using (e.g., PostgreSQL syntax for PostgreSQL engine).
- Check Engine Selection: Ensure that the Engine Selector is set to the correct database engine (e.g., PostgreSQL, Databricks) that matches the SQL dialect. Review your Engine configuration.
For more troubleshooting tips, see the Troubleshooting section.
7.3 Issue 3: Unable to Export Results
Description: Clicking the Export As button does nothing, or the downloaded file is empty.
Root Cause: The browser's pop-up blocker may be preventing the file from being downloaded, or the query may have failed.
Solution:
- Check Query Status: Ensure the query executed with a Success status before attempting to export results. If the query failed, there will be no data to export.
- Disable Pop-up Blocker: Temporarily disable your browser's pop-up blocker for the DataFuse AI site to allow the download to proceed.
- Check File Size: If the query returns millions of rows, the file may be too large for your browser or spreadsheet tool to handle. In this case, try limiting the number of rows by adding a
LIMITclause to your SQL query, such as:SELECT * FROM public.employee LIMIT 100; - Export Only Required Data: If the results are too large, you can export only a subset of the data, or apply filters to limit the data returned in the query.
8. Glossary of Terms
| Term | Simple Definition | Context / Importance |
|---|---|---|
| SQL | Structured Query Language used to query and manage relational databases. | The primary language used in the SQL Editor to interact with databases. |
| Connection Profile | A saved set of credentials and configuration details used to connect to a database. | Enables secure, reusable connections in the Data Connection Panel. Configure in theConnection Profile module. |
| Schema | A container that groups tables, views, and other database objects. | Organizes and structures database content, providing a clear hierarchy for navigation. |
| Compute Engine | The system or engine responsible for executing SQL queries (e.g., PostgreSQL, Databricks). | Determines available SQL syntax, performance, and execution behavior. Configure in theEngine module. |
| Metadata | Information describing database structure, such as table names, columns, and data types. | Displayed in the Data Connection Panel to help users understand database organization. |
| Tenant | A logical workspace or instance within DataFuse AI, typically representing an organization or team. | Ensures data isolation and secure access control. Learn more in theTenant User & Groups module. |
| Execution ID | A unique identifier assigned to each executed query. | Used for auditing, debugging, and tracking query activity in theRecent Queries tab. |
| CRUD | Acronym for Create, Read, Update, Delete—core operations for managing database records. | The Query Module primarily supportsRead operations today; future versions will support full CRUD capabilities via SQL commands. |
| Driver | A software component that enables DataFuse AI to connect to external databases and data sources. | Required for establishing connections. Manage them through theDriver module. |
Conclusion
By following this detailed guide, users can navigate the DataFuse AI Query Module with confidence, whether for everyday data analysis, generating reports, or troubleshooting SQL queries. The combination of easy-to-follow steps, real-world examples, and detailed explanations ensures that both novice and experienced users can fully leverage the capabilities of the platform to perform powerful data exploration and analysis.
Next Steps:
- Learn how to build data transformation workflows in the Pipeline module
- Automate your queries using the Job scheduler
- Explore data files in the File Explorer
If you have any further questions or need assistance, don't hesitate to reach out to your support team or refer to the DataFuse AI Help Center. Happy querying!